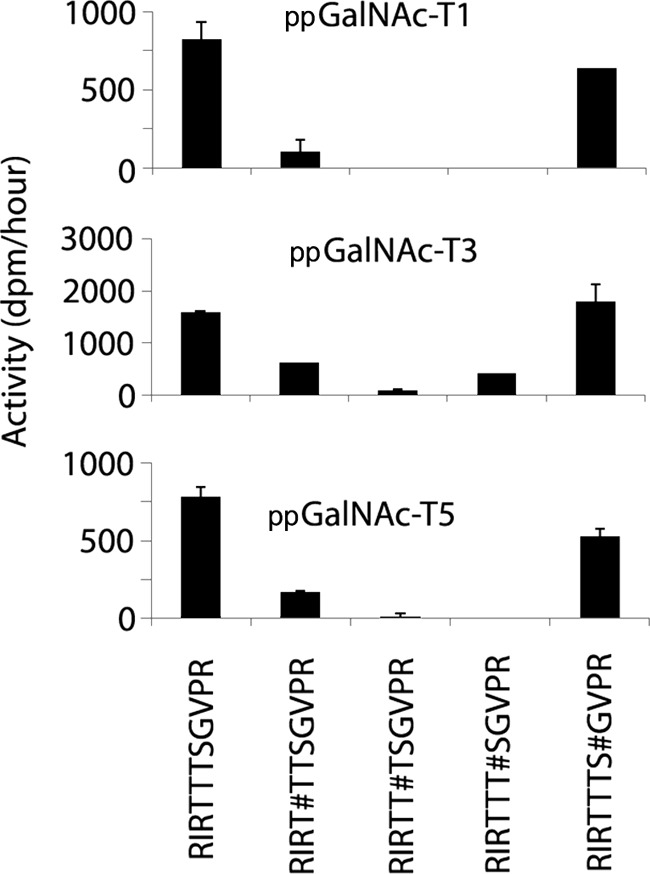
FIGURE 2.

Initial rates of ppGalNAc -T1, -T3, and -T5 against peptides and glycopeptides derived from the RIRTTTSGVPR region of α-DG. Initial rates (expressed as dpm/h) are shown on the vertical axes. Acceptor substrates are shown along the X axes. # denotes the position of mannose on the preceding amino acid.
