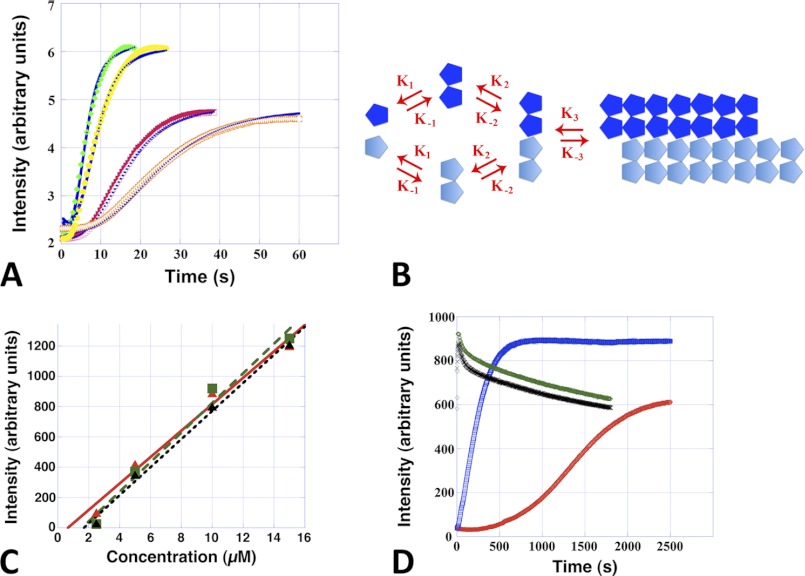
FIGURE 3.
Alp12 assembly kinetics in near-physiological high salt buffer. A, Alp12 polymerization followed by light scattering using a stopped-flow machine. Orange, 7.5 μm Alp12 and 1 mm GTP; red, 7.5 μm Alp12 and 1 mm ATP; yellow, 15 μm Alp12 and 1 mm GTP; green, 15 μm Alp12 and 1 mm ATP. Blue curves are the best fits obtained by DYNAFIT. B, the kinetic scheme used for the fit: monomers associate into dimers and then tetramers and then elongate. C, steady-state light scattering intensities plotted as a function of Alp12 concentration. Data points are averaged over three individual experiments. Green, Alp12-ATP; black, Alp12-GTP; red, Alp12-AMP-PNP. The intersection of the linearly approximated curves with the x axis defines the critical concentration. D, long-term light scattering observations. Due to mixing by hand, the initial 10–15 s could not be resolved, and the Alp12-ATP and Alp12-GTP curves start almost at the plateau of polymerization. Protein concentration was 8 μm. Green, 1 mm ATP; black, 1 mm GTP; blue, 1 mm AMP-PNP; red, 1 mm GMP-PNP. Note the slower polymerization in the presence of non-hydrolyzable nucleotides.

