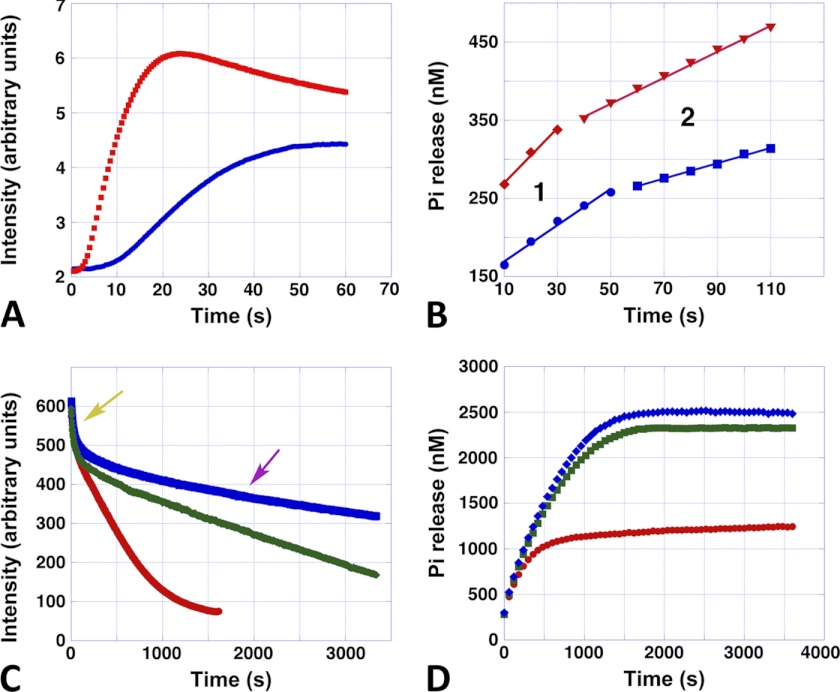
FIGURE 5.
Assembly, disassembly, and phosphate release. A, typical stopped-flow polymerization curves of Alp12 polymerized by 1 mm ATP. Blue, 7.5 μm Alp12; red, 15 μm Alp12. B, corresponding Pi release. Blue, 7.5 μm Alp12; red, 15 μm Alp12. The first ∼10 s could not be followed due to mixing by hand. Note that Pi release consisted of two phases (phases 1 and 2). C, disassembly monitored by light scattering. The Alp12 concentration was 15 μm. The ATP concentrations initially added were 100 μm (red), 500 μm (green), and 1000 μm (blue). Note the fast decreasing phase (yellow arrow), which was similar for all ATP concentrations. The second disassembly phase (purple arrow) was slower and depended on ATP concentration. D, corresponding Pi release. The Alp12 concentration was 15 μm. The ATP concentrations were 100 μm (red), 500 μm (green), and 1000 μm (blue). Pi release increased until it reached a plateau. The time to reach the plateau took substantially longer at 500 μm ATP than at 100 μm ATP, yet the difference between 500 and 1000 μm ATP was small. Similar behavior was observed for the total amount of Pi released (plateau height).

