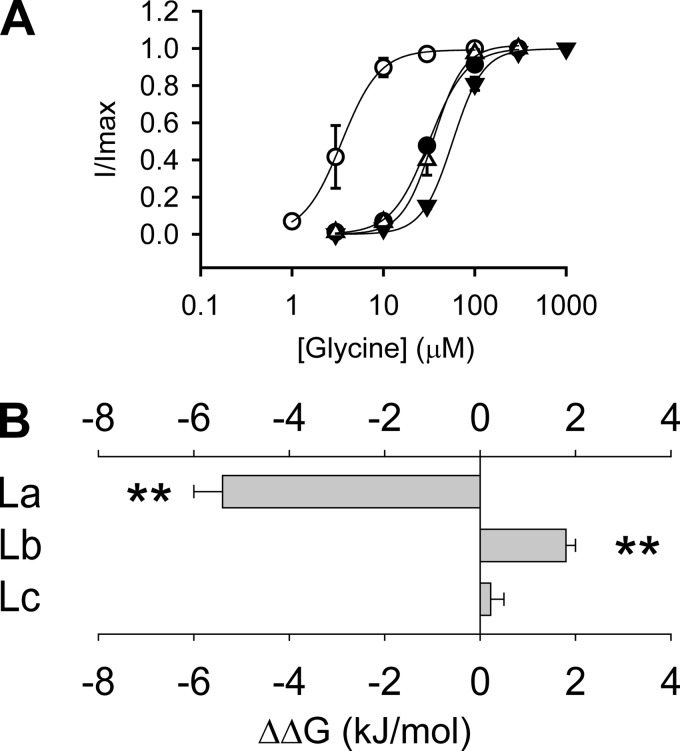
FIGURE 2.
Relative contributions of loops A, B, and C to glycine sensitivity at the β+/α− interface. A, averaged normalized glycine dose-response curves for the α1WT (●), αChLa (○), αChLb (▾), and αChLc (Δ) GlyRs. B, the glycine binding/gating energies contributed by loop A (La), B (Lb), and C (Lc) from the β+/α− interface, relative to the homologous loops in the α+/α− interface of the α1 GlyR (**, p < 0.01 using Student's t test). Note that the glycine dose-response curve for the α1WT is reproduced from Shan et al. (41).

