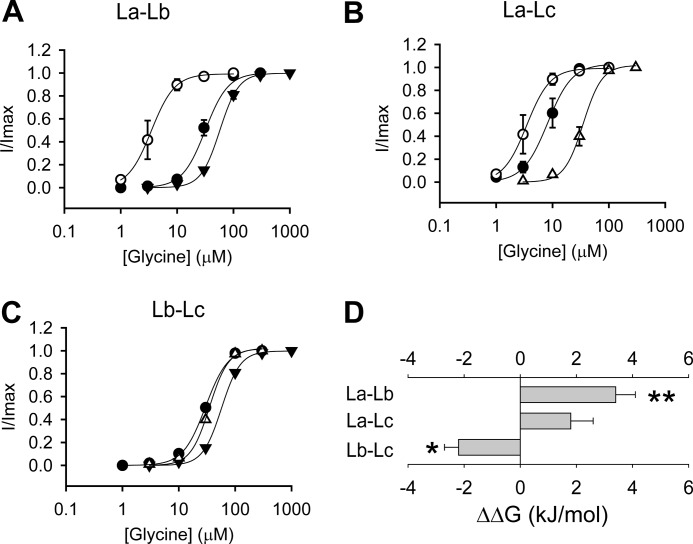
FIGURE 3.
Interactions between loops A, B, and C at the β+/α− interface. A, averaged normalized glycine dose-response curves for the αChLa (○), αChLb (▾), and αChLaLb (●) GlyRs. B, averaged normalized glycine dose-response curves for the αChLa (○), αChLc (Δ), and αChLaLc (●) GlyRs. C, averaged normalized glycine dose-response curves for the αChLb (▾) and αChLc (Δ) and αChLbLc (●) GlyRs. D, Interaction energy between loops A and B (La–Lb), loops A and C (La–Lc), and loops B and C (Lb–Lc) (*, p < 0.05 and **, p < 0.01 using Student's t test). The interaction energy is calculated, for instance between loops A and B, using the formula ΔΔG (interaction) = ΔΔG (αChLaLb GlyR) − ΔΔG (αChLa GlyR) − ΔΔG (αChLb GlyR).

