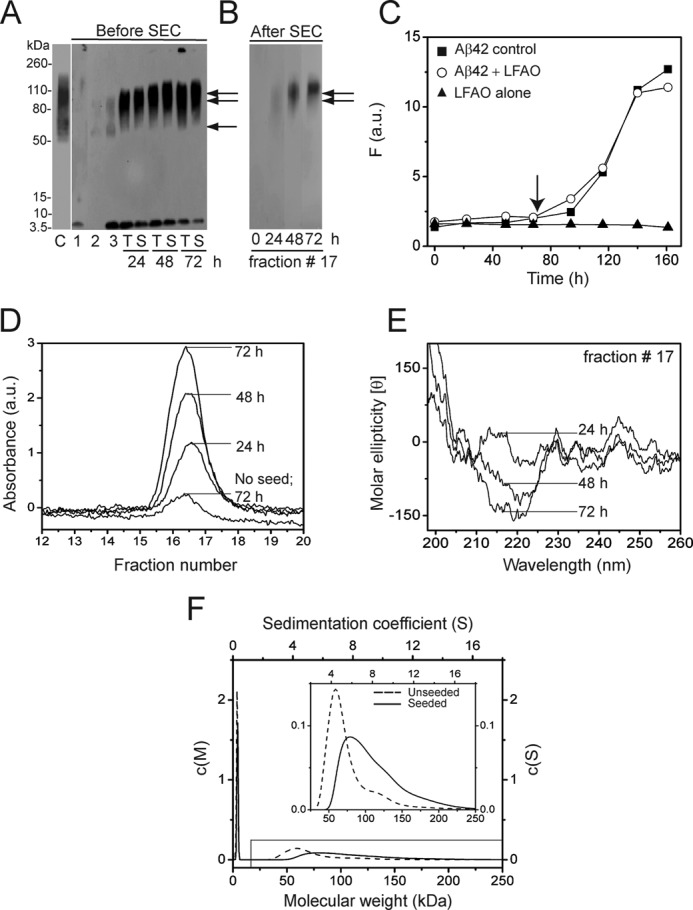
FIGURE 2.

LFAOs replicate upon interacting with monomers. A, immunoblot of 20 μm Aβ42 incubated with 0.4 μm LFAO (2% seed) for 72 h at room temperature before and after SEC. Lane C represents LFAO control (338 ng). Lanes 1 and 2 are Aβ42 control after 72 h in the absence of LFAO seed and LFAO alone (28 ng), respectively. Lane 3 is an aliquot of the 20 μm Aβ42 seeded with 0.4 μm LFAO immediately after incubation (0 h). Lanes T and S represent the total sample and supernatant of the sample after centrifugation at 19,000 × g for 20 min, respectively, at the indicated times of incubation. The volume of sample loaded was kept constant to ensure that 28 ng of the parent LFAO was maintained. B, immunoblot of fraction 17, fractionated by SEC after 24, 48, and 72 h of incubation of the samples in A (lanes S). C, ThT fluorescence data of the seeded reaction. The arrow indicates the 72-h point to which the seeding reaction was monitored. D, fraction 17 of the seeded samples that were fractioned on a Superdex-75 column after 24, 48, and 72 h along with a control sample (no seed) after 72 h. E, corresponding far-UV CD spectra of fraction 17. F, normalized relative molecular mass distributions (c(M) profiles) obtained from sedimentation velocity data for control LFAOs (dotted line) and seeded oligomers (smooth line). Inset, expanded region of the c(M) plot indicated in the figure. The results shown are representative of at least two reproducible results. F, fluorescence; a.u., absorbance units.
