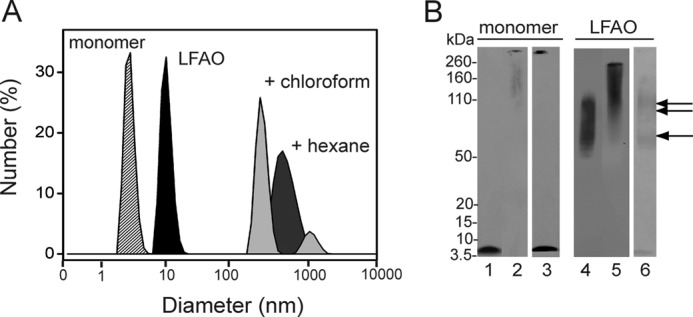
FIGURE 5.

LFAO agitation in interfacial environments. A, the increase in size of LFAO after agitation with 5% (v/v) hexane or chloroform in buffer followed by dialysis for 23 h was monitored by DLS. B, immunoblot of the agitation experiments along with monomer controls. Lane 1 shows control monomer Aβ42. Lanes 2 and 3 show the 23-h dialyzed Aβ42 monomer sample treated with chloroform and hexane, respectively. Lane 4 shows control LFAO. Lanes 5 and 6 show 23-h dialyzed LFAO treated with chloroform and hexane, respectively. The single and double arrows indicate 50–70- and 80–110-kDa bands, respectively.
