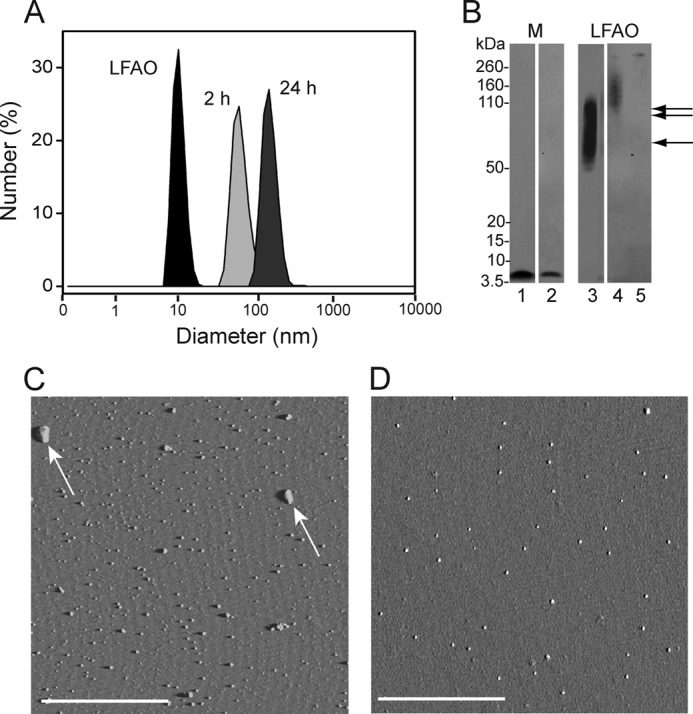
FIGURE 7.

Chloroform suspension experiment. A, LFAO was suspended over 100% chloroform solution, and the sample was removed from above the interface after 2 and 24 h to monitor the increase in size by DLS. DLS data indicate that the size of LFAO (black peak) was shifted from 11.03 to ∼80 nm in 2 h (light gray peak) and to ∼160 nm in 24 h (dark gray peak), indicating the formation of large aggregates. B, immunoblot showing Aβ42 monomer (M) and LFAO sample removed from above the interface after 24 h. Lanes 1 and 2 show control Aβ42 monomer and monomer sample removed from above the interface (in the aqueous buffer side), respectively, after 24 h. Lanes 3 shows control LFAO. Lanes 4 and 5 show the LFAO sample removed from above the interface after 2 and 24 h, respectively. The single and double arrows indicate 50–70- and 80–110-kDa bands, respectively. C, AFM image of chloroform interface sample after 24 h showing the presence of large clumps of aggregates (white arrows). D, AFM image of control monomer treated with chloroform interface shows no appreciable aggregate structure. The white scale bar represents 2.5 μm. The amplitude images are presented here and the z scale is 0–0.8 V.
