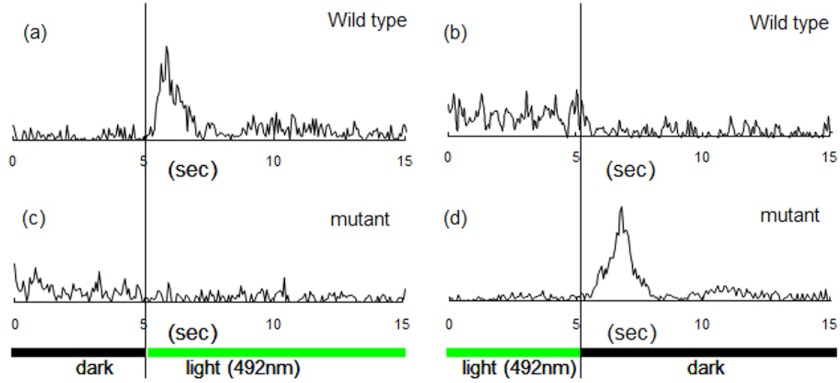
FIGURE 7.
Phototaxis responses by cells expressing wild-type and HAMP2-deleted SRII-HtrII. a–d, cell population swimming reversal frequencies measured by computer-assisted motion analysis during a step-up stimulus in 492-nm light (a and c) and step-down stimulus (b and d) for cells containing wild-type SRII-HtrII (a and b) or a HAMP2 excision mutant of SRII-HtrII (c and d). The illumination regime was cycles of 60 s of dark and 60 s of light. Frequencies are based on 50 cells for each condition.

