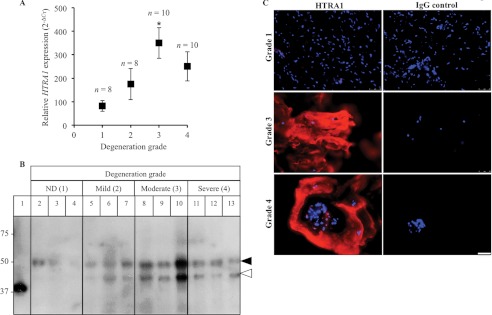
FIGURE 1.
Detection of HTRA1 in human IVD tissue. A, HTRA1 mRNA levels in intact IVD tissue samples from patients (n = 36) with varying degrees of IVD degeneration were determined by qRT-PCR and presented as 2−ΔCT. *, p < 0.05, as determined by one-way ANOVA Error bars, S.E. B, protein extracts from patient IVD tissues (n = 12) were loaded onto a 12% SDS-polyacrylamide gel, and immunoblotting was performed using a polyclonal antibody specific for HTRA1. Lane 1, HTRA1Δmac (4 ng); lanes 2–4, non-degenerated (ND) discs; lanes 5–7, mildly degenerated discs; lanes 8–10, moderately degenerated discs; lanes 11–13, severely degenerated discs. Closed arrowhead, 50-kDa HTRA1; open arrowhead, 42-kDa HTRA1. C, representative images of HTRA1 protein within frozen IVD tissue sections as identified by immunofluorescence staining. HTRA1 was detected using a Cy3-labeled secondary antibody (red), and nuclei were labeled with DAPI (blue). The specificity of staining was confirmed through the use of a nonspecific rabbit IgG control (IgG). Grade 1 represents a normal, non-degenerated IVD, whereas grades 3 and 4 signify moderate and severe degeneration, respectively. Scale bar, 50 μm.

