FIGURE 6.
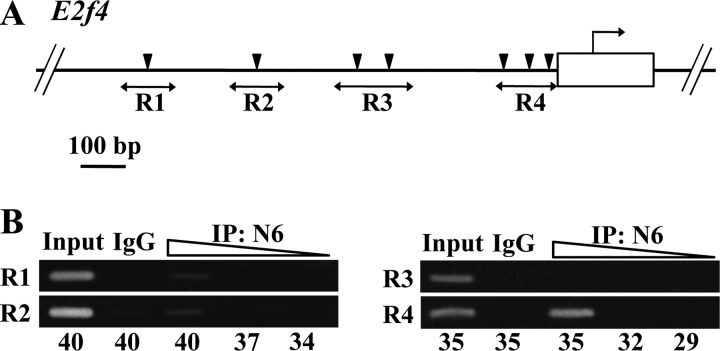
GATA1 regulates expression of E2f4 gene. A, schematic illustration of the upstream region of mouse E2f4 gene. Arrowheads indicate putative GATA-binding sites. Regions (R1 to R4) amplified in the ChIP analysis are shown with bidirectional arrows. B, ChIP analysis for detection of GATA1 occupancy in the upstream region of E2f4 gene. DNA fragments immunoprecipitated (IP) with GATA1-N6 antibody rendered for indicated cycles of amplification. A 10 times diluted input DNA was used as a positive control for PCR. Samples of control immunoprecipitation reaction with control IgG were also included. Note that the DNA fragments immunoprecipitated with antibody to GATA1 were amplified in the R4 region. Representative data from three independent experiments are shown.

