FIGURE 4.
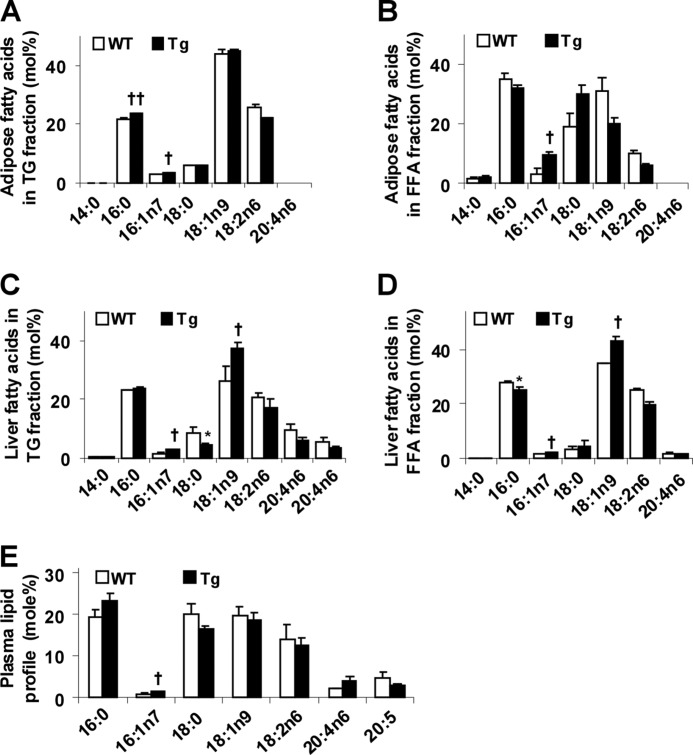
Overexpression of PFKFB3/iPFK2 in adipose tissue alters lipid profiles in adipose, liver, and plasma. At 5–6 weeks of age, male Tg and WT mice were fed an HFD for 12 weeks. A, lipid profile in triglycerides fractionated from adipose tissue samples. B, lipid profile in fatty acids fractionated from adipose tissue samples. C, lipid profile in triglycerides fractionated from liver samples. D, lipid profile in fatty acids fractionated from liver samples. E, plasma lipid profile. A–E, data are means ± S.E., n = 4–6. †, p < 0.05; ††, p < 0.01 Tg versus WT for the same fatty acid (A–E for an increase); *, p < 0.05 Tg versus WT (C and D for a decrease).

