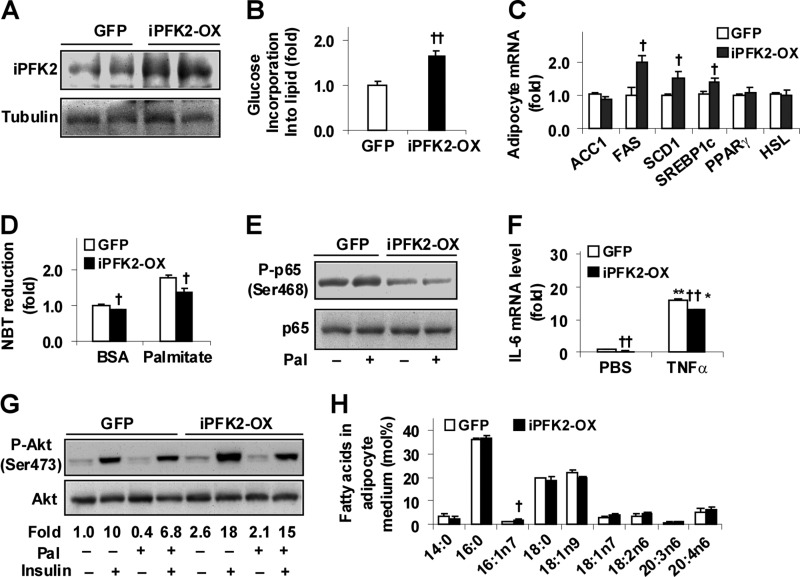
FIGURE 5.
PFKFB3/iPFK2 overexpression decreases adipocyte inflammatory response and improves insulin signaling while increasing fat deposition. Stable iPFK2-OX adipocytes and GFP-expressing adipocytes were established and subjected to metabolic and inflammatory assays. Each of the assays was performed at least in quadruplicate. A, amounts of iPFK2 in cells lysates were examined using Western blot analyses. B, changes in the rates of glucose incorporation into lipid. C, adipocyte gene expression was quantified using real time RT-PCR. D, production of ROS was measured using the nitro blue tetrazolium (NBT) assay. E, adipocyte inflammatory signaling. The levels of NF-κB p65 and phospho-p65 (Ser-468) were examined using Western blot analyses. F, adipocyte expression of IL-6. G, adipocyte insulin signaling. Prior to harvest, adipocytes were incubated with or without insulin (100 nm) for 30 min. Phospho-Akt (Ser-473) to Akt1/2 ratios were calculated using densitometry and expressed as fold changes. D–G, adipocytes were incubated with or without palmitate (250 μm) for 24 h (D, E, and G) or TNFα (10 ng/ml) for 6 h (F). H, lipid profile of adipocyte-conditioned medium. iPFK2-OX adipocytes and GFP-expressing 3T3-L1 were differentiated for 10 days before collection of conditioned medium. B–D, F, and H, †, p < 0.05; ††, p < 0.01 iPFK2-OX versus GFP (B) for the same gene (C) under the same condition (D and F) and for the same fatty acid (H). *, p < 0.05; **, p < 0.01 TNFα versus PBS for the same cell line in F.

