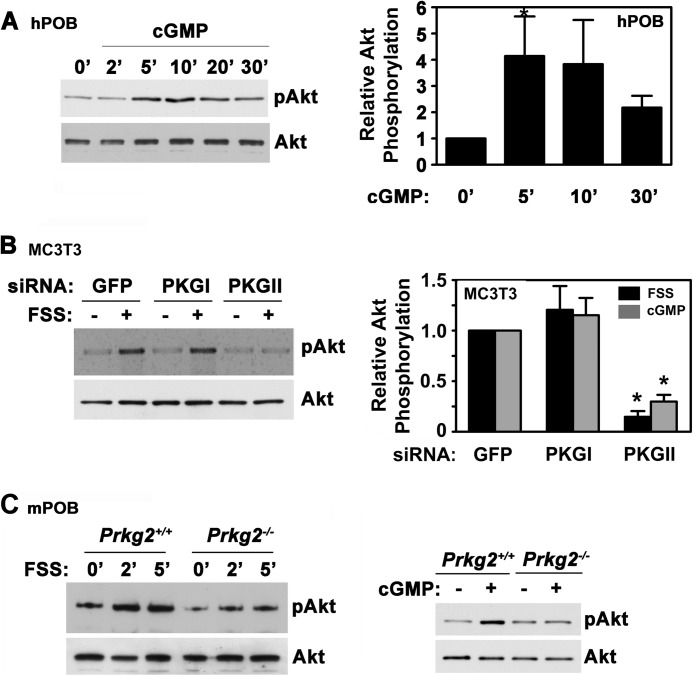
FIGURE 2.
cGMP and FSS activate Akt through PKG II. A, serum-deprived hPOBs cells were treated with 50 μm 8-pCPT-cGMP for the indicated times, and Akt phosphorylation was assessed as described in the legend to Fig. 1A. The bar graph on the right summarizes three experiments. *, p < 0.05 for the comparison between cells cultured in the absence and presence of cGMP. B, MC3T3 cells were transfected with siRNAs targeting GFP (control), PKG I, or PKG II. After 48 h, cells were either subjected to FSS for 10 min (+, black bars in the graph on the right) or were kept under static conditions (−), as described under “Experimental Procedures.” Some cells were treated with 50 μm 8-pCPT-cGMP (cGMP, gray bars) for 10 min under static conditions. Akt phosphorylation was measured as in Fig. 1A, with the relative amount of pAkt found in FSS- or cGMP-treated cells transfected with GFP siRNA assigned a value of 1 (*, p < 0.05 for the comparison between cells transfected with PKG II siRNA versus GFP siRNA). C, primary calvarial osteoblasts isolated from wild type (Prkg2+/+) or PKG II-deficient (Prkg2−/−) mice were stimulated with either FSS for the indicated times (left panels) or with 100 μm 8-CPT-cGMP for 5 min (right panels). Akt phosphorylation was analyzed as in Fig. 1A (representative of two (for FSS) or three (for cGMP) experiments). Error bars, S.E.

