
FIGURE 4.
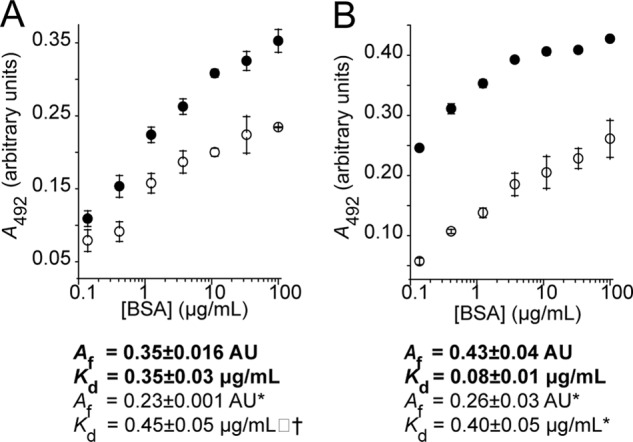
ELISA: BSA preferentially binds to adsorbed stressed target proteins compared with the native form. ADH (A) was stressed by incubation at 45 °C, whereas insulin (B) was denatured using DTT at 37 °C. Bound BSA was detected using a monoclonal BSA antibody followed by a secondary HRP-conjugated antibody. Equation 5 was fitted to the data to obtain a maximum absorbance (Af) and a dissociation constant (Kd). Stressed proteins are shown in filled circles with kinetic parameters in bold type, whereas native target proteins are shown in open circles with kinetic parameters in normal type. Significance was tested using a Student's t test. Differences between binding of BSA to stressed and unstressed proteins was significant for both ADH and insulin (p < 0.001), and differences in kinetic parameters between stressed and unstressed series had significance as indicated. *, p < 0.005; †, p < 0.05. The data shown are the means ± standard deviation of triplicate measurements; each data set provided is representative of three independent experiments.