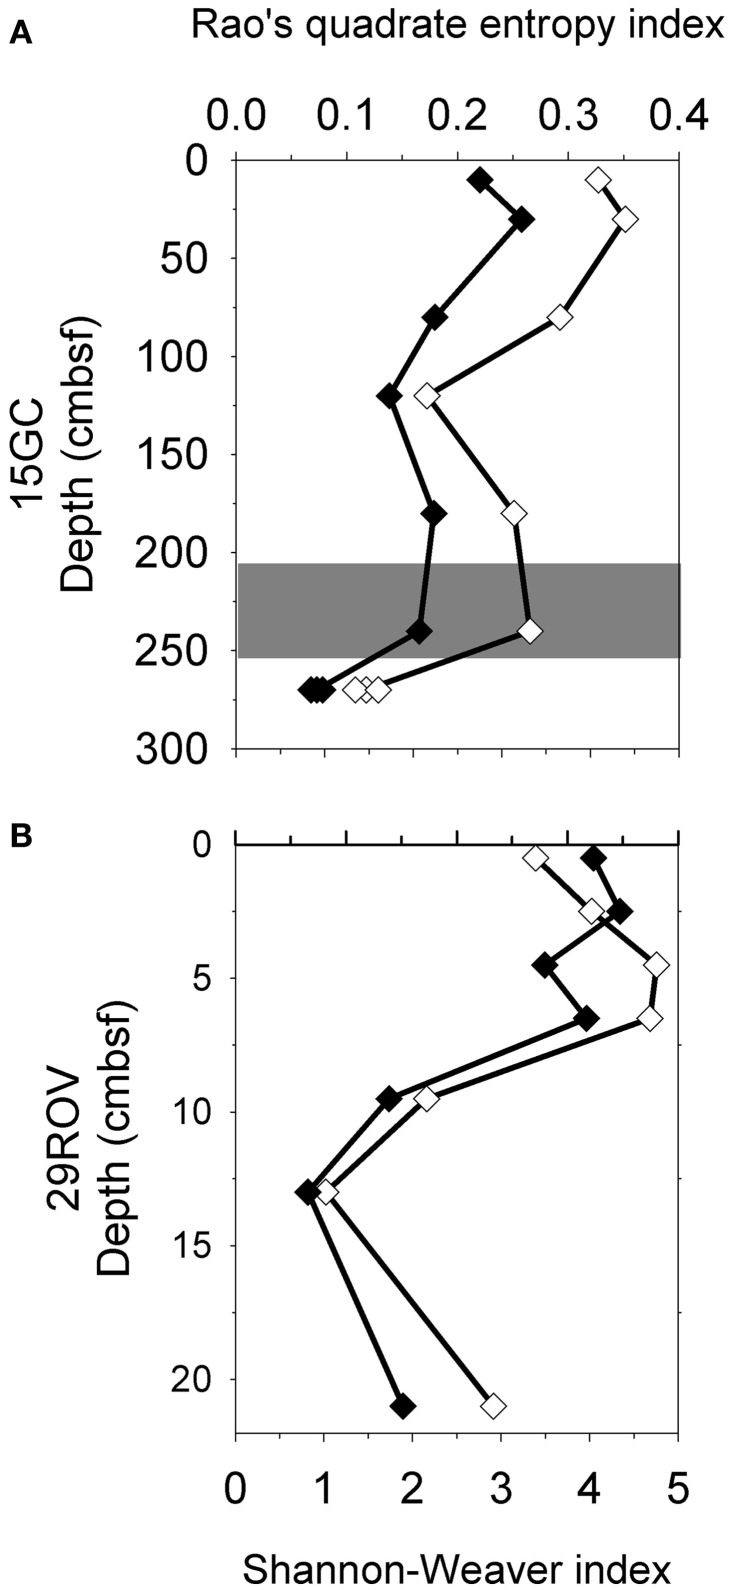
Figure 4.
Diversity estimations using Shannon–Weaver index (♦) and Rao’s quadrate entropy index (⋄) for 15GC (A) and 29ROV (B). The standard deviation for subsamples within 15GC and 29ROV were calculated to be 0.041–0.068 and 0–0.078 for the Shannon–Weaver index, respectively, and between 3.04–8.67 × 10⁻³ and 0–9.05 × 10⁻³ for the Rao’s quadrate entropy index, respectively. All standard deviation bars are smaller than the size of symbols displayed in the figure. The gray area indicates the sulfate-methane transition zone in 15GC (A).

