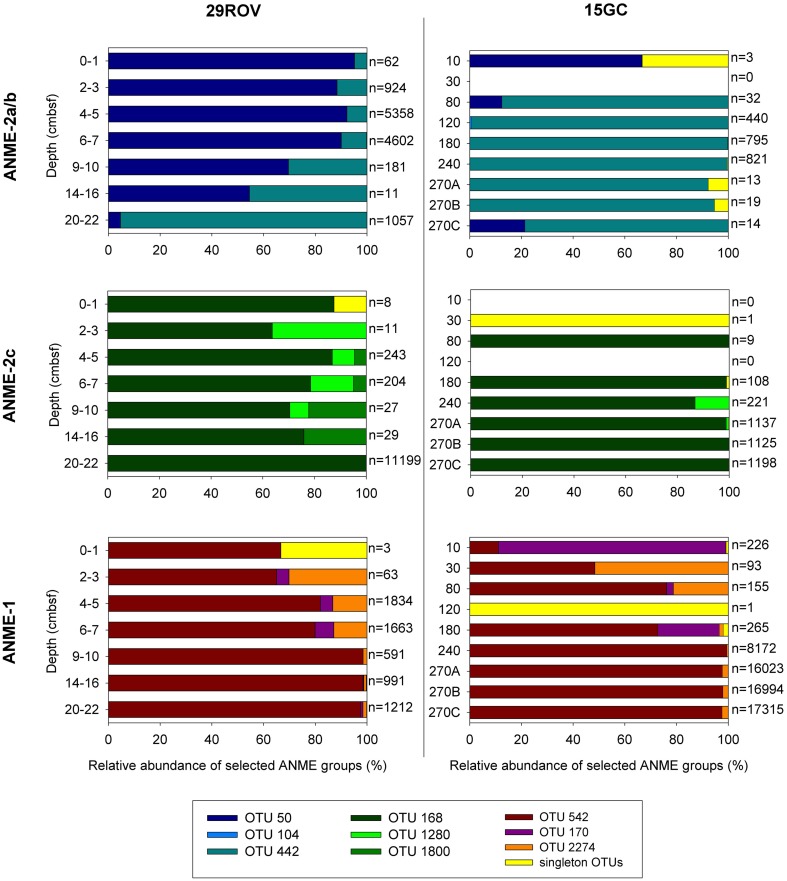
Figure 5.
Anaerobic methanotrophs (ANME)-affiliated sequences from the 15GC and 29ROV amplicon libraries were clustered into OTUs (97% cut-off). The relative distribution of different OTUs affiliated to either ANME-2a/b, ANME-2c, or ANME-1 within each sediment horizon is shown in separate graphs for 15GC and 29ROV. The numbers listed beside each bar indicates the total number of reads assigned to each of the three ANME subgroups. This number is summed to 100% and displayed on the x-axis. All OTUs represented by only one sequence are pooled and presented in the category “singleton OTUs.” The subsample 270 cmbsf from 15GC was analyzed in triplicates, hence the marking A, B, and C on the y-axis.

