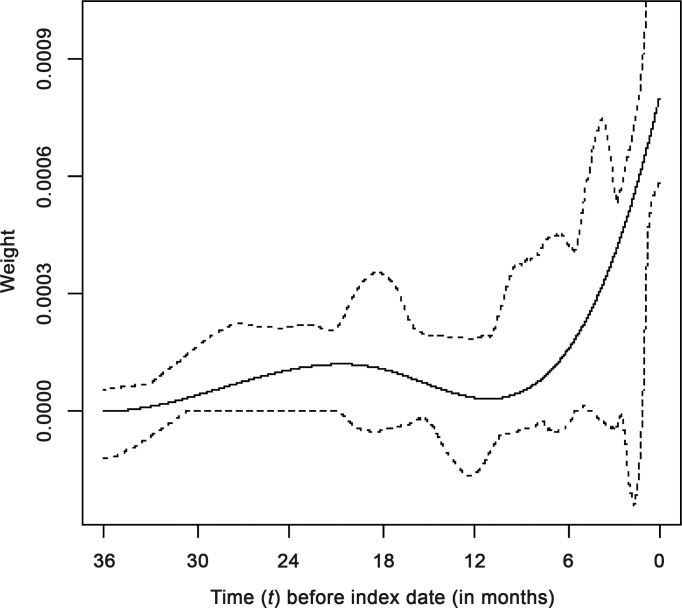
Figure 1.
Estimated weight function (solid curve) and pointwise 95% bootstrap CI (dotted curves) for the final weighted cumulative dose model of the association between previous oral glucocorticoid exposure and serious infection. The final WCD model used 3 degrees of freedom to model the weight function (see Supplementary Online Materials). Relative risks associated with specific exposure patterns are derived from the weighted sum of past doses, with weights shown on the y-axis. Accordingly, the total impact of continuing exposure (in terms of log OR) during a given time period corresponds to the area under the weight curve (over the corresponding time interval).

