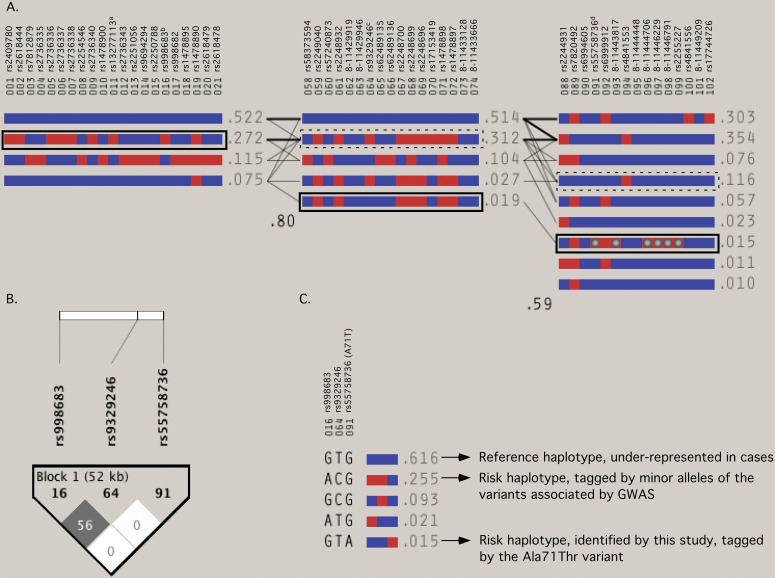
Figure 2.
Structure of associated BLK haplotypes. (A) Haplotypes formed by single-nucleotide polymorphisms (SNPs) in each associated block B1, B3 and B5 as estimated with expectation maximisation algorithm (Haploview v.4.1). Blue and red squares represent major and minor alleles, respectively. To the right of each haplotype, its population frequency (cases and controls) and connections between blocks (thin lines if >1%, thick lines if >10%) are displayed. In crossing areas are the values of the multiallelic D′ which represent the level of recombination between two blocks. See table 1 for haplotype-specific ORs and p values. Haplotypes associated with increased risk of developing systemic lupus erythematosus are enclosed within rectangles (solid line if p<1×10⁻³; dashed line if p<0.05). B1 contains a risk haplotype tagged by rs998683-A(b) (strongest hit in this study) and its proxies including the rs13277113-A allele(a) previously described.1 Blocks B1 and B3 are highly correlated. B3 contains SNP rs9329246(c), which is shared by the two strongest four-SNP windows of the whole BLK locus. B5 contains the independent risk haplotype tagged by the mutant allele of the rs55758736/Ala71Thr non-synonymous SNP(d) and a set of highly correlated allelic variants (grey circles). The independence of B5 risk haplotype is further supported by (B) the linkage disequilibrium plot displaying r2 values between the representative variants of each block and (C) the relationship between their alleles.

