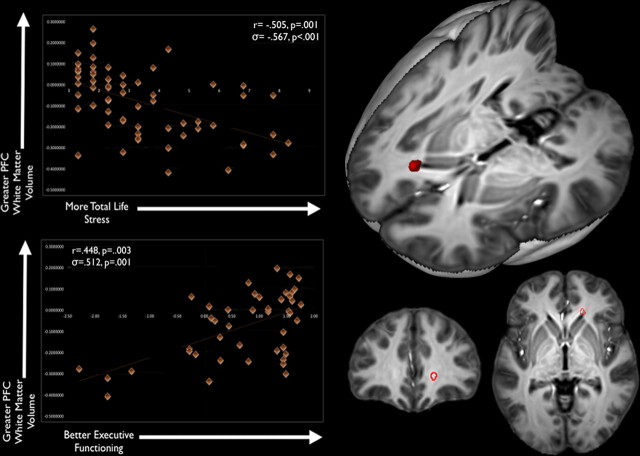
Figure 2.
Variations in PFC white matter are associated with individual differences in both cumulative life stress and SWM performance. Brain images show the results of logical AND conjunction analyses, in which PFC white matter is negatively associated with cumulative life stress (p < 0.005, uncorrected) and positively associated with SWM performance (as indexed by fewer errors and higher Z-scores) (p < 0.005, uncorrected). The scatter plot for cumulative life stress and PFC white matter volume is shown in the top left corner, whereas the scatter plot for SWM performance and PFC white matter volume is shown in the bottom left corner.

