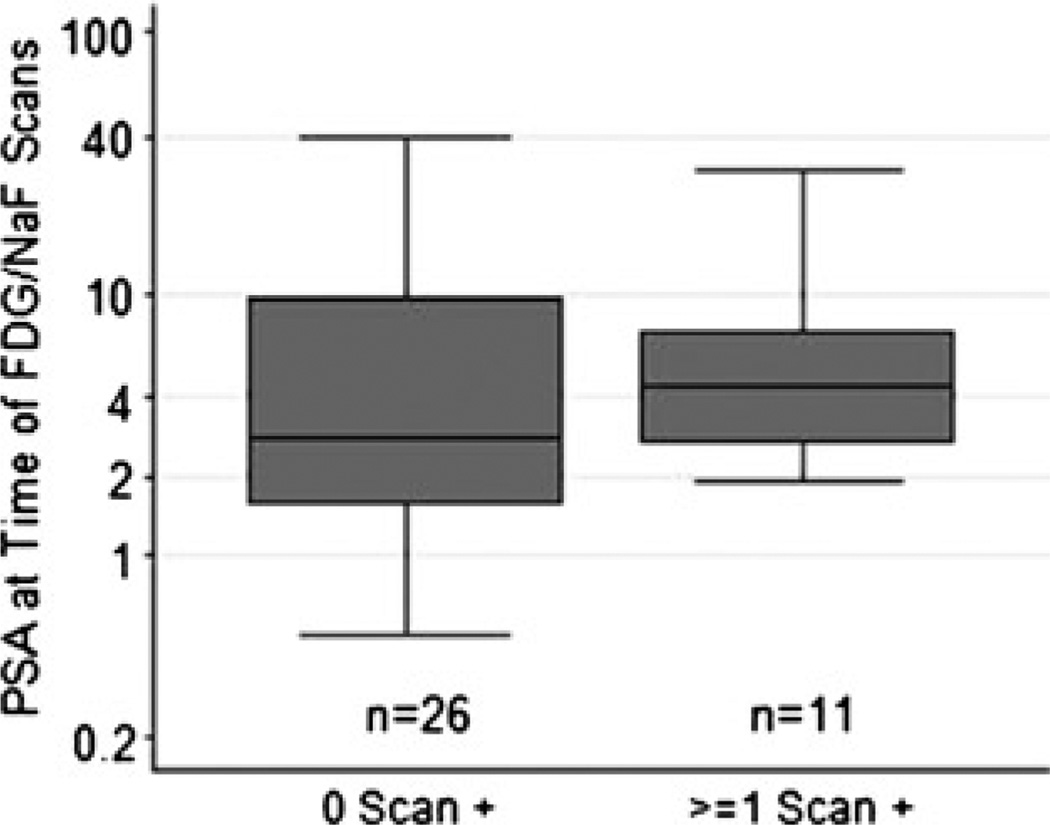
FIGURE 3.
Box-and-whisker plot of the PSA values (log scale) at the time of PET/CT scans for patients with negative PET/CT scans comparing to those with 1 or more positive PET/CT scans. The difference in median PSA levels between the groups was not significant (P = 0.42). The line inside the box, box margins, and whisker margins represent the median value, interquartile ranges, and ranges, respectively.

