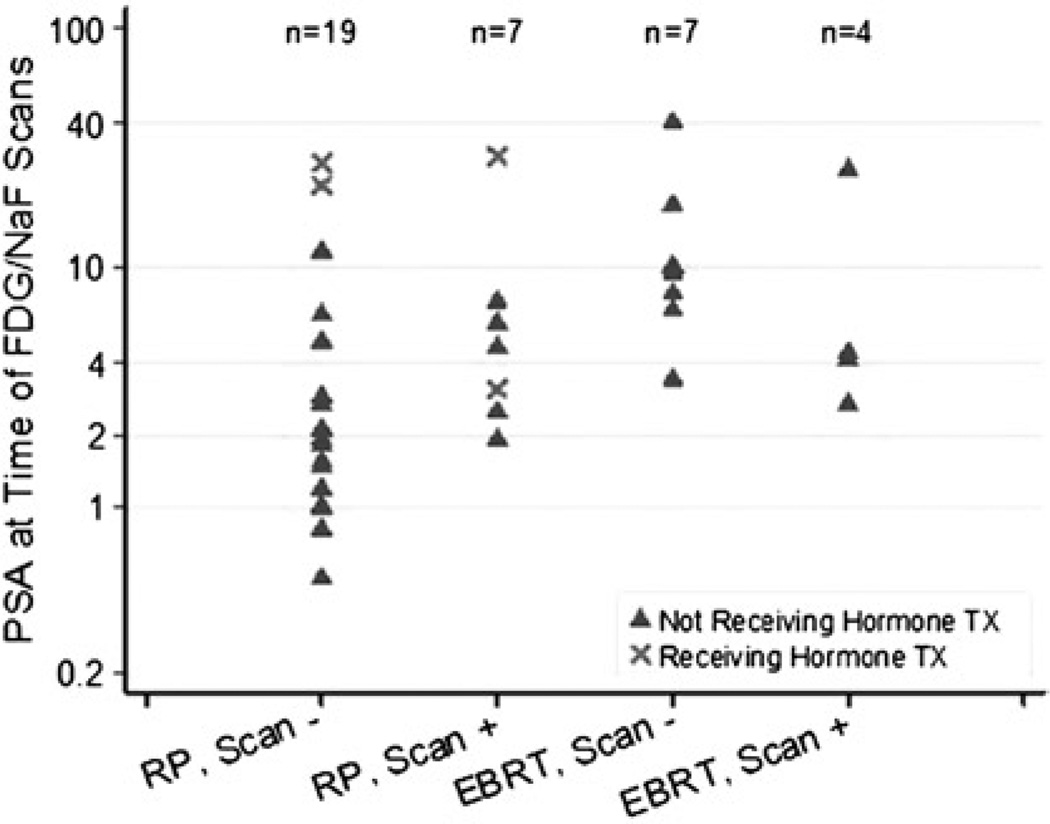
FIGURE 4.
Values (log scale) of PSA at the time of PET/CT scans stratified by the patients’ primary therapy (RP or EBRT) and scan positivity. Patients with previous RP showed a marginally higher median PSA level in the positive PET/CT group in comparison to those with negative PET/CT scans (4.6 vs 2.1 ng/mL, P = 0.072).

