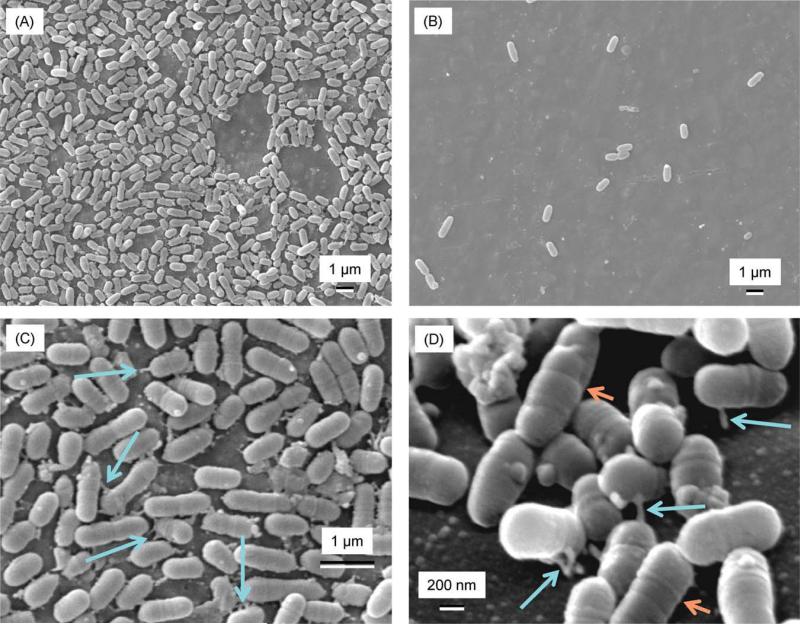
FIGURE 5.
SEM micrographs of S. mutans on: (A) Hybrid composite, (B) nanocomposite with 40% NACP, (C) hybrid composite at an intermediate magnification, and (D) hybrid composite at a high magnification. The hybrid composite was nearly entirely covered by bacteria. The RMGI (not shown) had less bacteria coverage. The nanocomposite (B) had the least bacteria. The bacterial cells had developed extensions (indicated by arrows in C). These extensions are shown more clearly in (D) as indicated by the long arrows. S. mutans had the shape of a short rod with wall bands on its surface (indicated by the short arrows). [Color figure can be viewed in the online issue, which is available at wileyonlinelibrary.com.]

