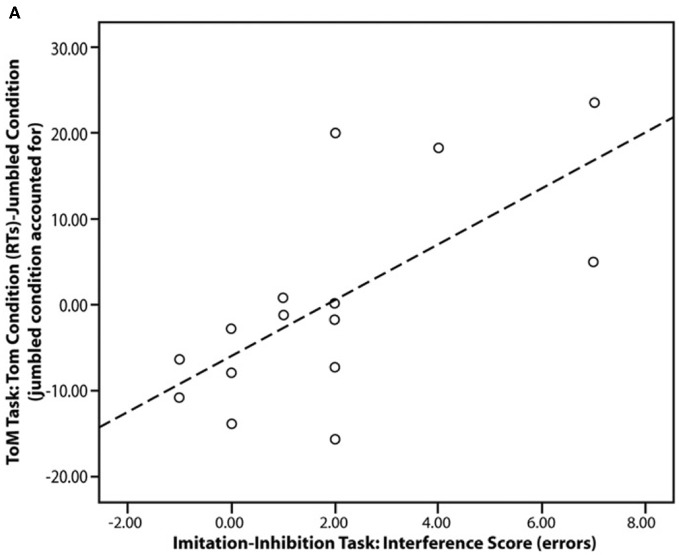
Figure 3.
Scatter plot showing the significant correlation in the ASC group between imitation-inhibition (interference score) and reaction times in the mentalising task (ToM, Theory of Mind condition). Figure is reproduced, with permission, from Spengler et al. (2010a).

