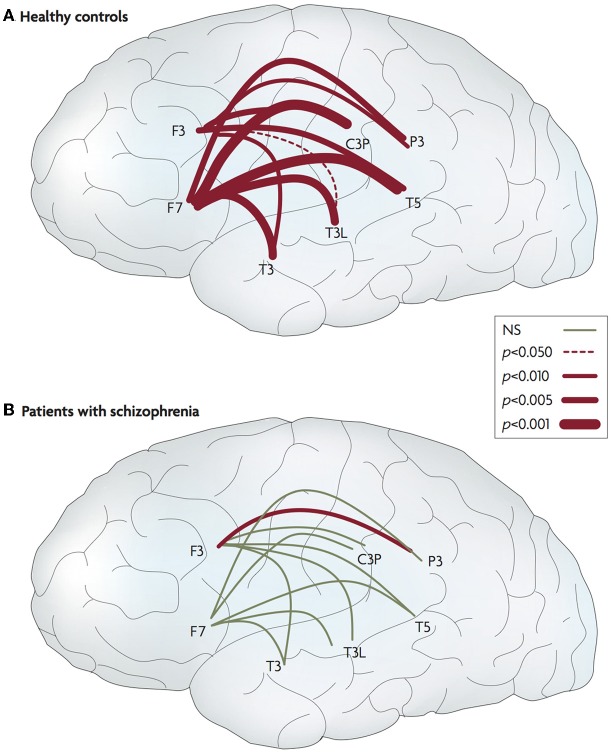
Figure 5.
Abnormal connectivity in the brain in schizophrenia. Lateral views of the left hemisphere of the brain. The red lines connect areas that exhibited greater frontotemporal electroencephalogram coherence during talking than during listening for normal controls and patients with schizophrenia. The thickness of the line indicates the probability level for the t-tests that compared the findings. The thicker the line, the larger the difference between the two coherences. In the controls, coherence during talking was greater than during listening for all 20 of the electrode pairs. In the patients, coherences during talking were greater for only two of the pairs (one in each hemisphere). NS, not significant. Data from Ford et al. (2002). Figure and caption is reproduced, with permission from Fletcher and Frith (2009).

