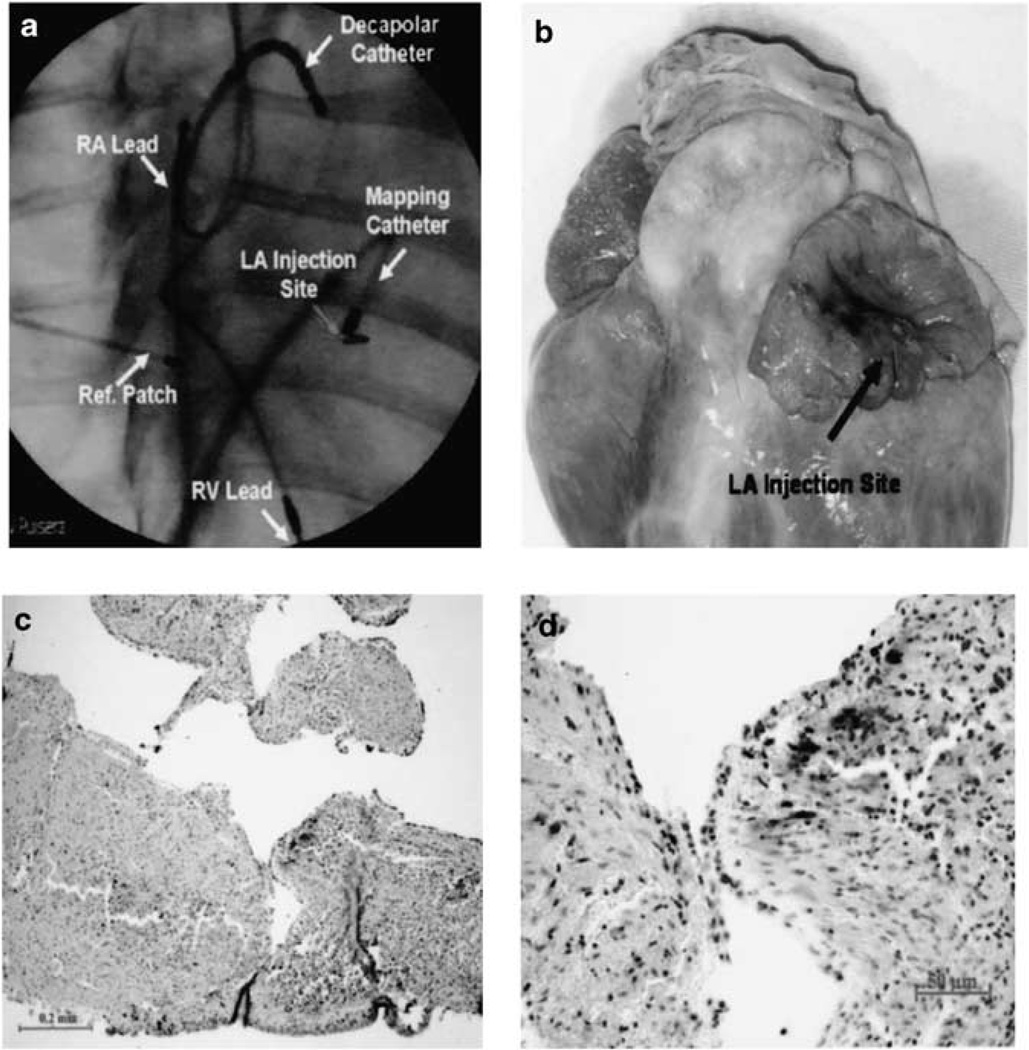
Figure 4.
(a) Fluoroscopic image showing pacing leads at the RA and RV apex, the decapolar catherter at the roof of RA against the intra-atrial septum and the mapping catheter in the LA during electroanatomic mapping. The site of injection was marked by a surgical clip (red arrow). Reffered patch indicates reference patch for anatomical mapping. (b) Gross pathology showing the injection site at the LA apendage (arrow). (c and d) Sectioned heart demonstrating the expression of GFP with GFP staining (brown) ath low (left) and high (right) magnifications.

