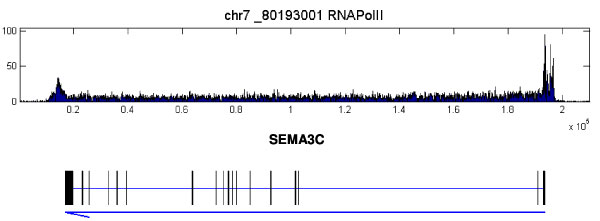
Figure 1.

Examples of PolII ChIP-seq data for MCF7 cell line. ChIP-seq data for PolII binding pattern on SEMA3C in MCF7 cell control samples. The top lane shows the histogram of the PolII binding densities over a range of genome. The gene covered by this range is shown in the bottom lane. In the bottom lane, the thick bars below the gene symbol indicate exons of the gene while the blue arrow indicates its orientation. The tail and head of the arrow correspond to the transcription starting site (TSS) and transcription ending site (TES) of the gene respectively. The same arrangements are also applied to the other figures. It is apparent that PolII not only binds to the TSS regions of the gene but also form long enriched regions over the entire transcript.
