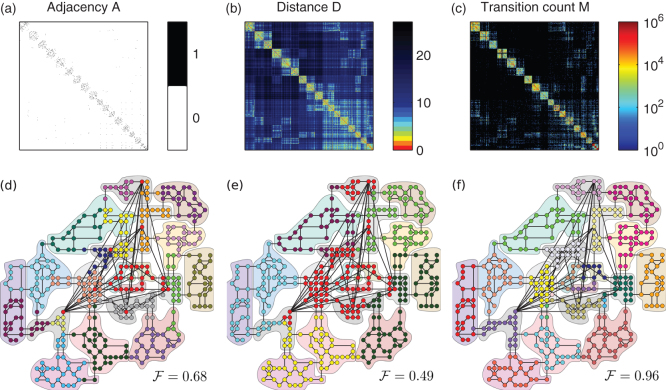
Figure 4. Extracting communities from network topology and from mobility patterns.
(a) The adjacency matrix A of the universe network, (b) the matrix D of shortest path distances, and (c) the matrix M of transition counts of player jumps. Each of the three matrices contains 400 × 400 entries, whose values are colour-coded. Sector IDs are ordered by cluster, resulting in the block-diagonal form of the three matrices. We have used modularity-optimization algorithms to extract community structures from the information encoded in the three matrices. Different node colours represent the different communities found, while the 20 different colour-shaded areas indicate the predefined socio-economic clusters as in Fig. 1. The displayed Fowlkes and Mallows index  quantifies the overlap of the detected communities with the predefined clusters. The closer
  is to 1, the better the match, see Supplementary Section S4. (d) Although information contained in the adjacency matrix A allows to find 18 communities, a number close to the real number of clusters, the communities extracted do not correspond to the underlying colour-shades areas (
 ). (e) Extracting communities from the distance matrix D only results in 6 different groups (
 ). (f) The 23 communities detected using the transition count matrix M reproduce almost perfectly the real socio-economic clusters (
 ), with only a few mismatched nodes detected as additional clusters. For more measures quantifying the match of communities, see Supplementary Table II.

