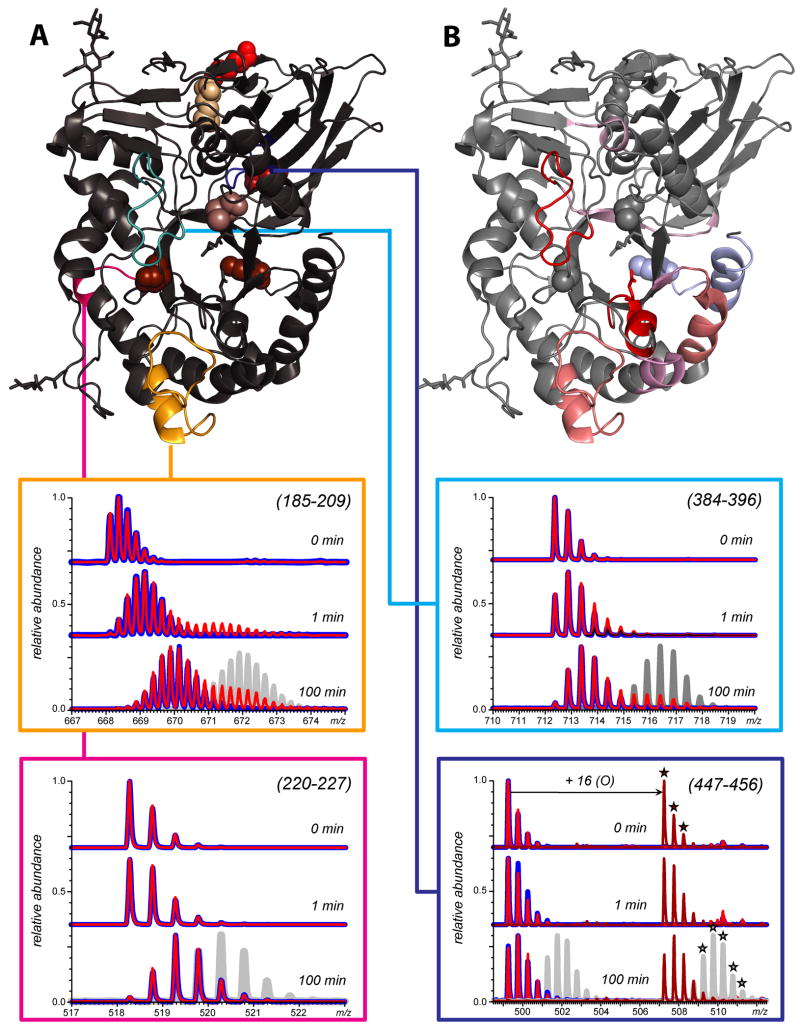
Figure 6.
Isotopic distributions of peptide ions representing peptic fragments (185-209, 220-2270, 384-396, and 447-456) of GCase (blue) and GCase-ox (red) following 1 and 100 min of HDX in solution. The gray traces represent isotopic distributions within the same peptide for acid denatured GCase, which allowed for complete exchange (e.g., the maximum level of amide exchange for the peptide) and was analyzed under the same conditions as native GCase. Location of these segments within the crystal structure of GCase is shown in structure A. Local backbone amide protection deduced from HDX MS measurements mapped to GCase structure are colored based on ΔHDX (difference between oxidized and intact forms of GCase, exchange time 100 min) is shown in structure B.

