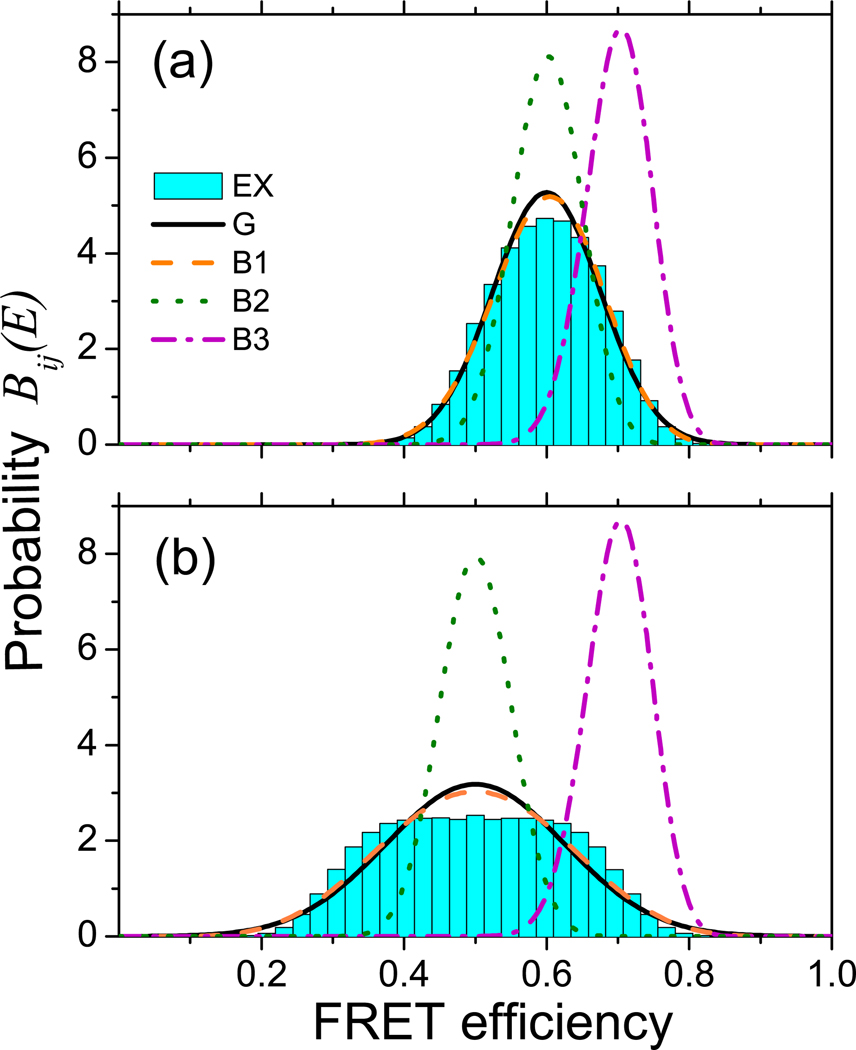
Figure 3.
Comparison of various approximations for the probability of FRET efficiency, Bij(E), in the bins that undergo a single j → i transition. The exact (EX) histograms (bars) are calculated using Eq. (21). They are compared with the Gaussian (G) distribution (solid line, Eqs. (33)–(35)) and with Beta distributions, Eq. (36), with three different sets of parameters: parameters B1 result in the correct mean and variance (dashed line, Eq. (37)), B2 are determined by the average count rates (dotted, Eq. (38)), and B3 by the count rates of the initial state (dashed-dotted, Eq. (39)). Mean number of donor and acceptor photons in a bin is nT = 100, FRET efficiencies of the states are (a) ℰi = 0.5, ℰj = 0.7; (b) ℰi = 0.3, ℰj = 0.7

