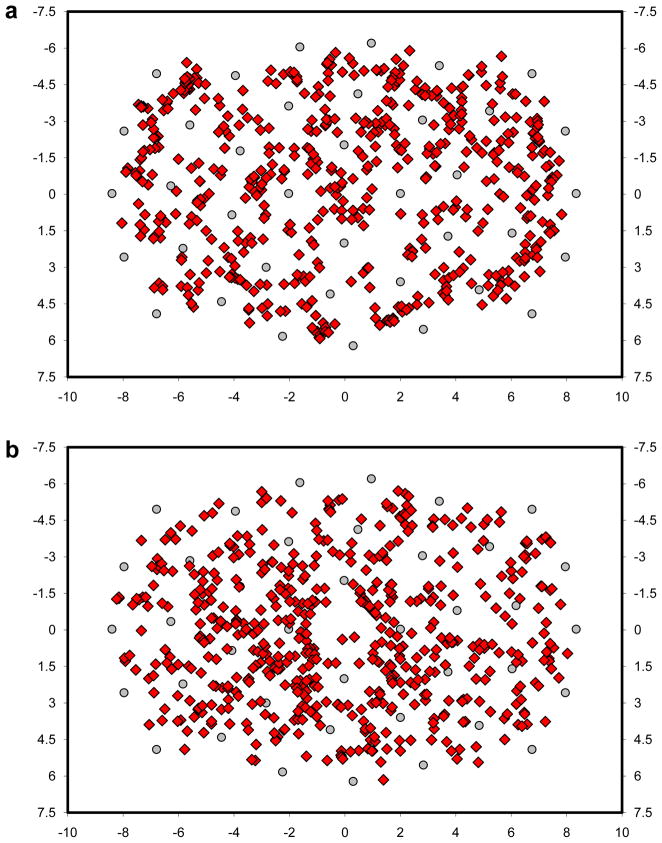
Figure 3.
Scatterplots showing search fixations greater than 1.0° from an object for (a) a representative observer, and (b) TAM. Possible object locations are indicated by the gray circle markers, and axes are in degrees of visual angle relative to center. Note that fixations appearing closer than 1.0° from an object marker are not errors; these fixations are from trials in which no object occupied that location.

