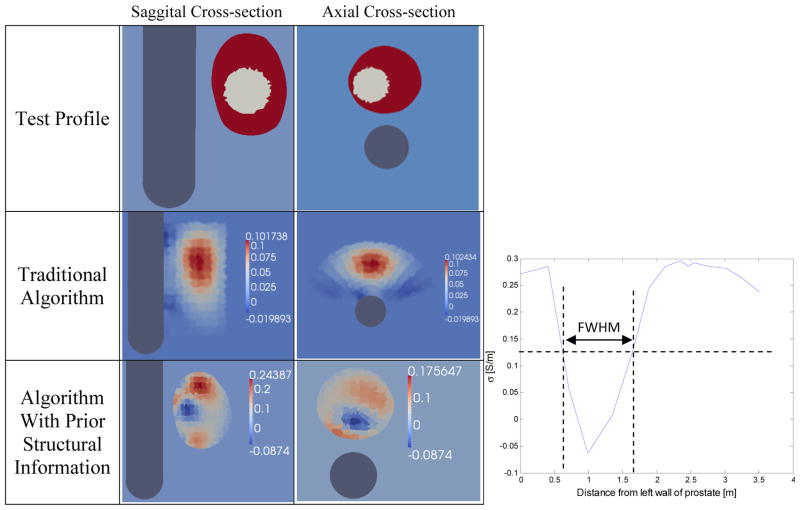
Figure 8.
Difference reconstructions of synthetic data (row 1) without (2nd row) and with the use of structural information (3rd row). 4th column: The graph shows the reconstructed conductivities along a horizontal row of elements from the saggital cross-section of the reconstruction using the developed algorithm. The diameter of the reconstructed inclusion was estimated as the Full Width at Half Maximum (FWHM) of this conductivity profile.

