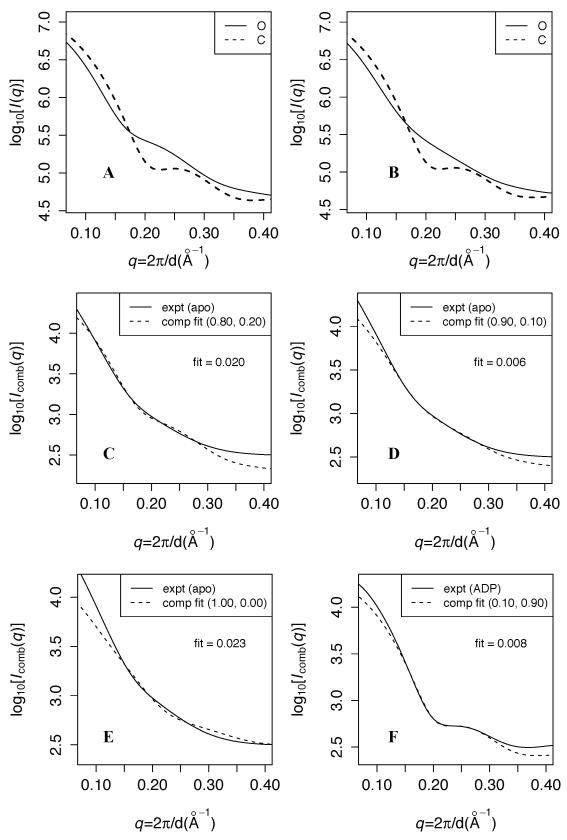
Figure 1. Experimental vs. predicted SAXS curves at different contact energy scales.
A and B: Predicted scattering at contact energy scales (Scon) of 2.5 and 1.9, respectively. The solid (dashed) line indicates the prediction from the O (C) simulation. For each calculation, predicted scattering (I(q)) is averaged over 1000 randomly selected structures from the corresponding simulation ensemble, and log10[Iavg(q)] is plotted. C, D, and E: fits of log10(Icomb) at Scon = 2.5, 1.9, and 1.5, respectively, to the apo experimental data over 0.14 < q < 0.3. Icomb is the optimal linear combination of predicted O and C scattering to fit the data; the weights (wO,wC) are indicated in parentheses. “fit” in each panel indicates the root mean square deviation between experimental and fitted computational data over that q range. F: fit of log10(Icomb) at Scon = 1.9 to the ADP-bound experimental data.

