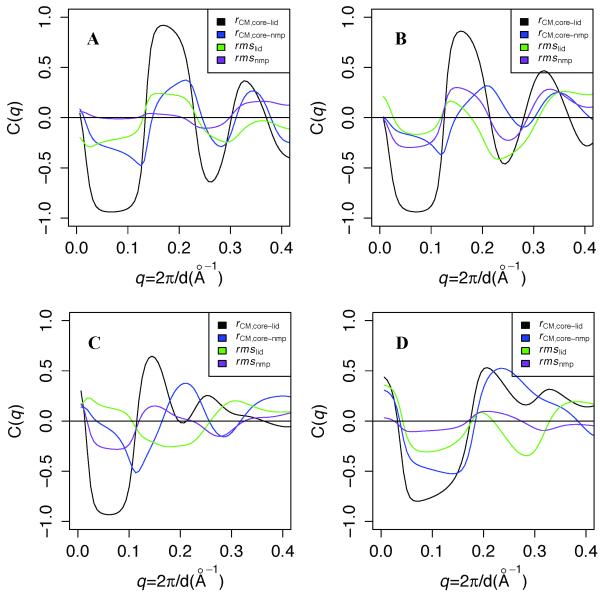
Figure 2. Ensemble correlation of scattering with various Cartesian structural metrics.
A, B, and C plot ensemble correlation C(q) between predicted scattering and several structural metrics in O simulations at Scon = 2.5, 1.9, and 1.5, respectively, and panel D shows C(q) for the C simulation at Scon = 1.9. rCM,core-lid and rCM,core-nmp denote center of mass distances between the CORE domain and the LID and NMP domains, respectively, and rmslid and rmsnmp denote the Cα root mean square deviations of LID and NMP, respectively, to the closed crystal structure. C(q) is calculated for each Cartesian metric for each simulation as described in the results.

