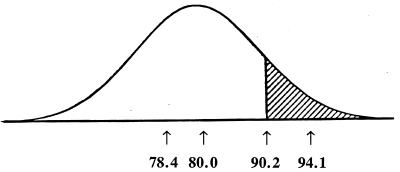
Figure 2.
Truncation selection. All of the individuals to the right of the truncation point (those in the shaded area) are eliminated by pre-reproductive death or failure to reproduce. In this example, 10% are eliminated and 90% contribute to the next generation. From left to right, the numbers along the abscissa are the mean number of mutations per individual in the selected group, in the population before selection, at the truncation point, and in the group eliminated by selection.

