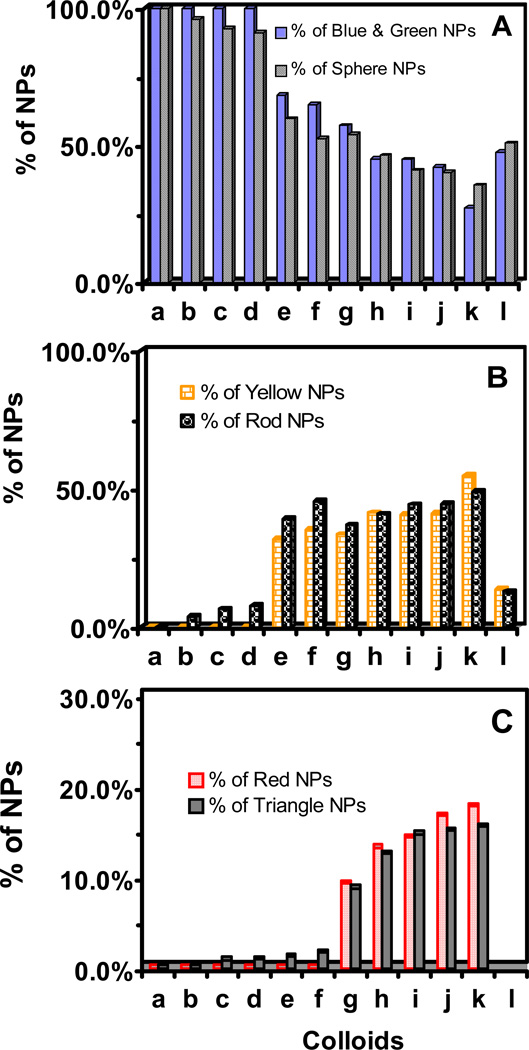
Figure 4.
Study of shape-dependent LSPR spectra (λmax) of single NPs for colloids in Figure 1. Correlations of percentage of single (A) plasmonic blue and green NPs with spherical NPs; (B) plasmonic yellow NPs with rod NPs; and (C) plasmonic red NPs with triangular NPs. Peak wavelengths (λmax) of LSPR spectra of single blue, green, yellow, and red NPs are 476 ± 5, 533 ± 12, 611 ± 23, and 711 ± 40 nm, respectively.

