
Figure 7.
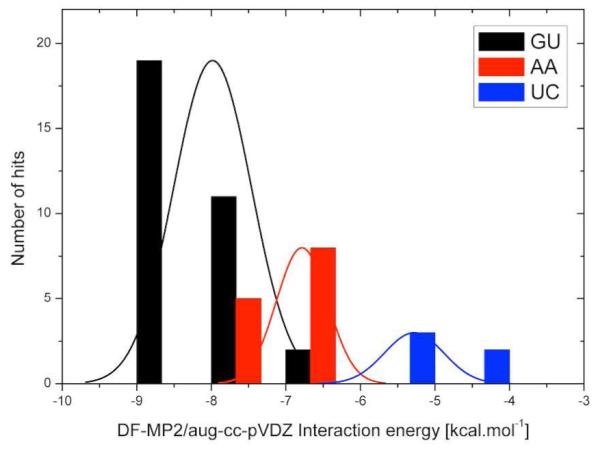
Distribution of the DF-MP2/aug-cc-pVDZ interaction energies of the GU (black), AA (red), and UC (blue) base pairs. The interaction energy axis is partitioned into seven bins of 1.0 kcal.mol−1 width. The solid curves, shown in the same colors, are the corresponding standard Gaussian normal distributions computed from the interaction energy data and thus with an infinitesimal bin width. Note that the AA interaction energies would be further reduced (in absolute value) by ~1 kcal.mol−1 if the artificial C9Met(A)…N7(A) interactions were excluded. Since most of the experimental structures were determined at low atomic resolution, the energy variability primarily reflects the error of the experiments.