
Figure 7.
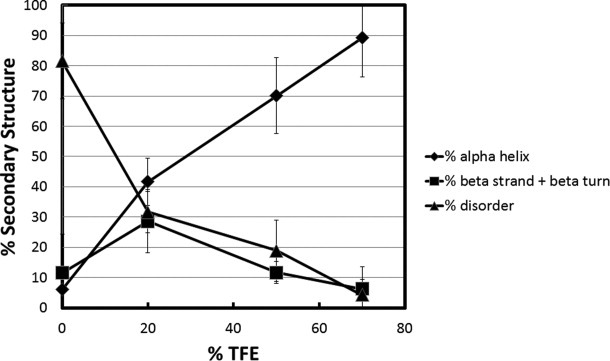
Secondary structure content versus TFE concentration for the transcription repression domain (TRD) of MeCP2. Percent secondary structure was plotted against % TFE after deconvolution of CD data from using CDpro software. The % disordered (▴), % α-helix (♦), and % β strand/turn (▪) subsequently were plotted against each TFE concentration.