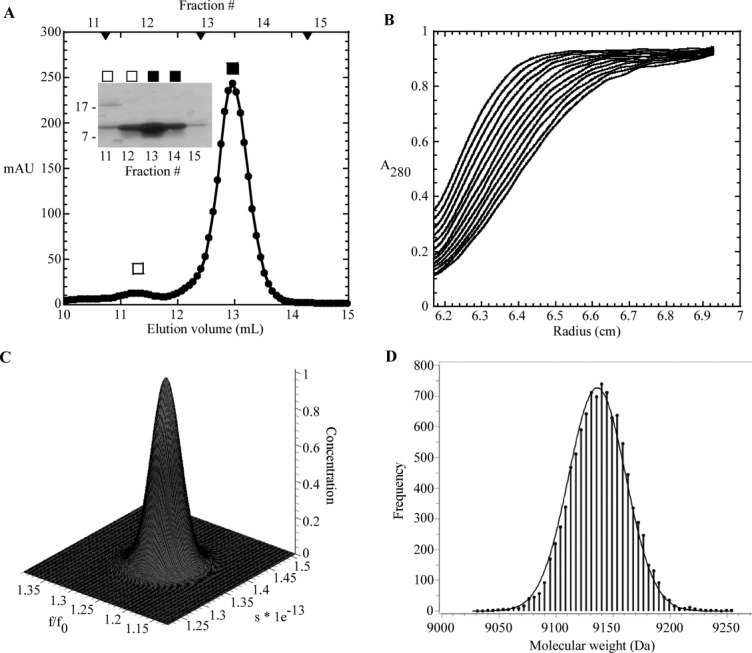
Figure 5.

S-75 gel filtration and analytical ultracentrifugation of sRI. A: Elution profile of sRI with major monomer peak (▪) and minor dimer peak (□) indicated. S-75 standards are indicated by arrow heads, from left to right: 29, 13.7, and 6.5 kDa. Inset: Coomassie-stained gel of samples collected from each gel filtration fraction. B: Sedimentation velocity of sRI (at various concentrations, see “Materials and Methods”). The positions of the moving boundaries shown are at ∼6 min intervals by spectrophotometric scanning at 280 nm. C: Genetic algorithm/Monte Carlo analysis of the sRI sedimentation velocity data with frictional ratio and sedimentation coefficient shown. The concentration axis shows that no other species exist in the samples analyzed in the sedimentation velocity experiment. D: Measurement of the molecular mass of sRI by fitting of sedimentation equilibrium data performed at varying sRI concentrations (see “Materials and Methods”). The frequency distribution describes the statistical confidence level for each molecular weight calculation.40
