
Figure 1.
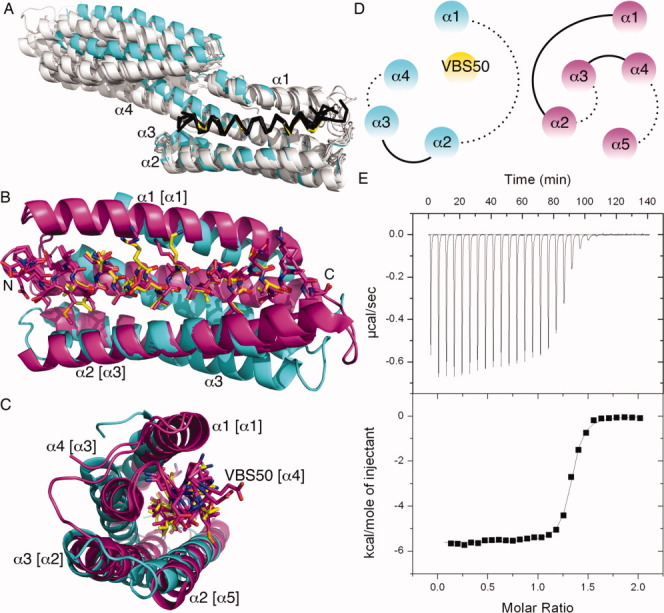
Talin-IBS2 unfurls upon binding to vinculin. A: Superposition of the crystal structures of all talin-VBSs (shown as Cα traces) in their Vh1-bound states (shown as a cartoon) onto our Vh1:VBS50 (Vh1, cyan; VBS50, yellow). Vh1 α-helices α1 through α4 are labeled. VBS1 (residues 608-627), VBS11 (residues 822–841), VBS2 (residues 855–874), VBS33 (residues 1525–1544), VBS36 (residues 1633–1652), VBS3 (residues 1949–1968), and VBS58 (residues 2345–2364) are shown in black bound to Vh1, which is shown in white, and they were aligned to VBS50 (residues 2080–2099). The N-terminal Vh1-bound subdomain structures are almost identical while the C-terminal four-helix Vh1 subdomain that does not bind to these VBSs is found in several relative orientations relative to the N-terminal four-helix bundle subdomain. B: Cartoon drawing of human vinculin Vh1 domain (cyan) in complex with VBS50 of the talin IBS2 (shown in yellow) ball-and-stick representation. Human VBS50 (residues 2079–2097) in their Vh1-bound state are superimposed onto VBS50 as seen in the IBS2 crystal structures from mouse (magenta, PDB entry 3dyj; only one subunit of the asymmetric unit is shown) and Drosophila melanogaster (magenta, PDB entry 3fyq) with r.m.s.d. of 0.4 Å and 0.28 Å for 133 or 90 atoms, respectively. This superposition places α1 (labeled, residues 7–26) of Vh1 in a similar position as α1 of IBS2 (residues 1976–2001; bracketed α1) but with opposite directionality; α2 of Vh1 (residues 40–62) similarly to α5 of IBS2 (residues 2108–2138); α3 (Vh1 residues 68–95) similarly to α2 of IBS2 (residues 2011–2037); and α4 of Vh1 (residues 102–129) similarly to α3 of IBS2 (residues 2040–2068) with a relative tilt of about 45°. The termini of VBS50 are labeled (N and C, respectively). C: Perpendicular view, along the horizontal axis of panel B. α-Helices α1-α4 of Vh1 are labeled, which are structurally similar to α-helices [bracketed] α1 (residues 1975–2001), α5 (residues 2108–2139), α2 (residues 2011–2037), and α3 (residues 2040–2069) of IBS2, respectively, while VBS50 (residues 2078–2099) is α-helix α4 in the mouse and Drosophila IBS2 crystal structures (residues 2073–2102). D: Topologies of Vh1 in complex with VBS50 (left) and VBS50 within the IBS2 domain (right) in the same orientation and color coding as in panel C. Dotted lines indicate connectivity of the respective α-helices, which are on the bottom of the α-helices in this view. E: ITC titration of VBS50 to vinculin. The total heat exchanged during each injection of VBS50 to Vh1 is fit to a single-site binding model with stoichiometry, KD and ΔH° as independent parameters, where N = 1.3, KD = 99 nM, ΔH° = −5544 ± 24 cal mol−1, and TΔS = 3.98 kcal mol−1 or N = 1.3, KD = 97 nM, ΔH° = −5673 ± 23 cal mol−1, and TΔS = 3.71 kcal mol−1 for a second independent experiment (not shown). No significant heat exchange was observed for VBS50 titration into the reaction buffer alone.