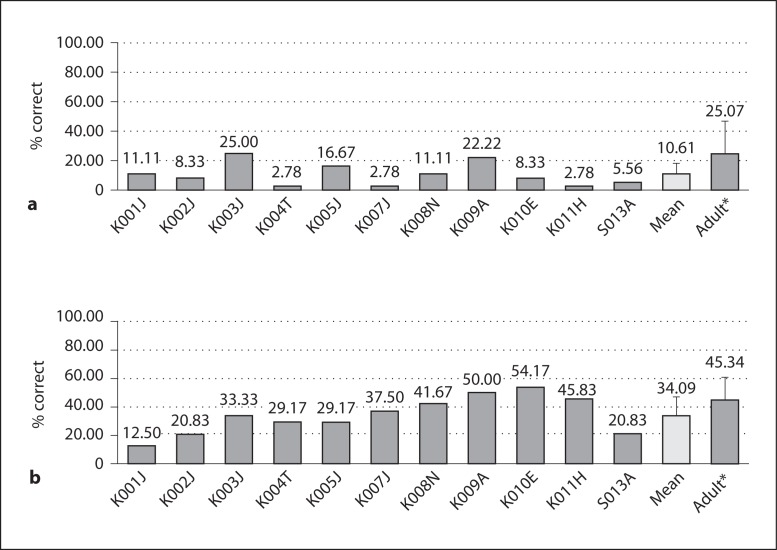
Fig. 6.
a Melody identification scores. The children's melody scores were not significantly different from the chance level of 8.3% (one-sample t test, p = 0.35). b Timbre identification scores. The children's mean timbre scores were worse than those of the adults (t test, p = 0.039). Error bars indicate 1 SD. * Adult data (n = 42) adopted from Kang et al. [2009].

