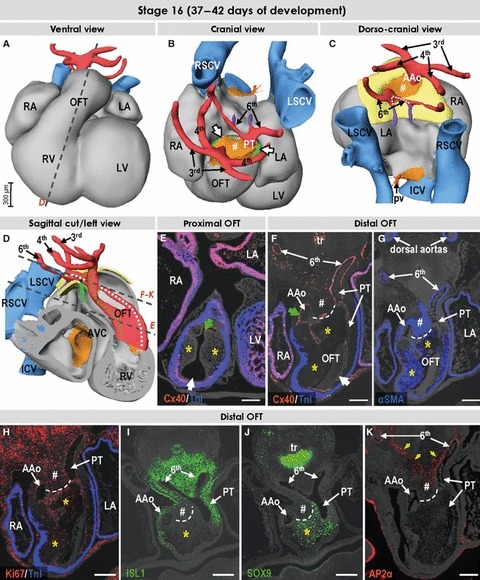
Fig. 6.

Three-dimensional (3D) and molecular analysis of the cardiac outflow tract at stage 16. (A–C) The muscular outflow tract has further shortened, and the mass of the right ventricle is recognisable ventrally. The extrapericardial portions of the perpendicularly oriented ascending aorta and pulmonary trunk are separated from each other by mesenchymal tissue (# in B,C). The dotted line in (C) points to the decreasing distance between the origin of the pulmonary arterial branches. (D) The relations between developing ascending aorta and pulmonary trunk (white and green dotted lines, respectively) now resemble the situation seen in the formed heart. (E) Section through the proximal outflow tract showing the still unfused endocardial cushions producing aortic and pulmonary arterial channels (green and white arrows, respectively). (F–K) Sections through the distal outflow tract, which were incubated with antibodies as indicated. The protrusion from the dorsal wall of the aortic sac now extends into the pericardial cavity (#), and interposes between the ascending aorta and the pulmonary trunk. The contact between the protrusion and the distal ends of the outflow tract cushions expressing SOX9 (yellow asterisks) is marked by a dashed line. The yellow arrows in (J) point to the sharp border of the AP2α expression domain. Scale bars: 200 μm. For abbreviations, see previous figures.
