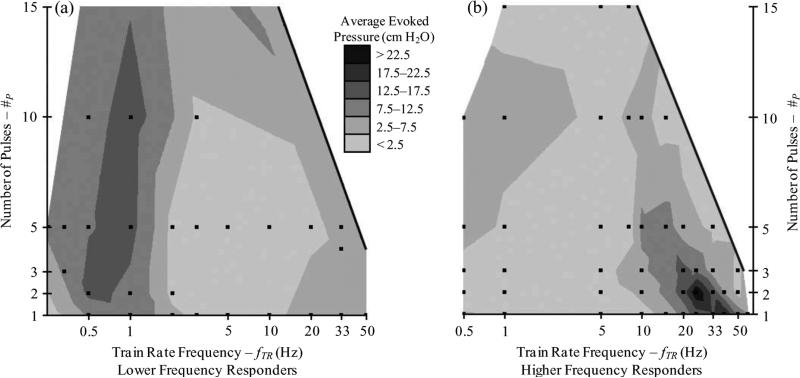
Fig. 5.
Contour plots of average evoked pressure (PAVE–EV) against number of pulses (#P) and train rate frequency (fTR), for (a) lower frequency responding and (b) higher frequency responding experiments. Preferred ranges indicate that the addition of pulses results in greater evoked pressures than that evoked by continuous frequency stimulation at #P = 1. The dots indicate locations of stimulus parameter combinations that were included; 280 trials across 27 stimulus parameter combinations in (a) and 293 trials across 47 stimulus parameter combinations in (b). The region outside the solid line indicates the limit of the parameter space where adding pulses leads to a continuous stimulation frequency, equal to or greater than the pulse frequency (fPU), for a pulse frequency of 200 Hz.

