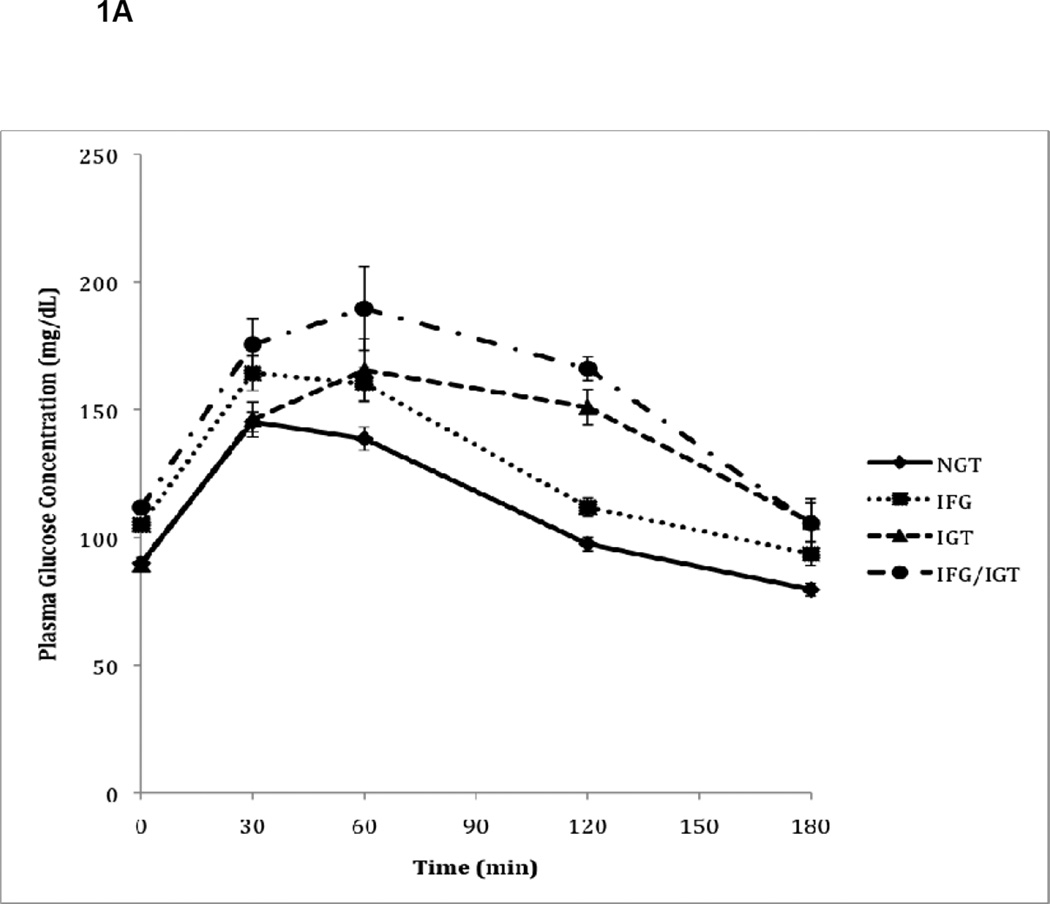
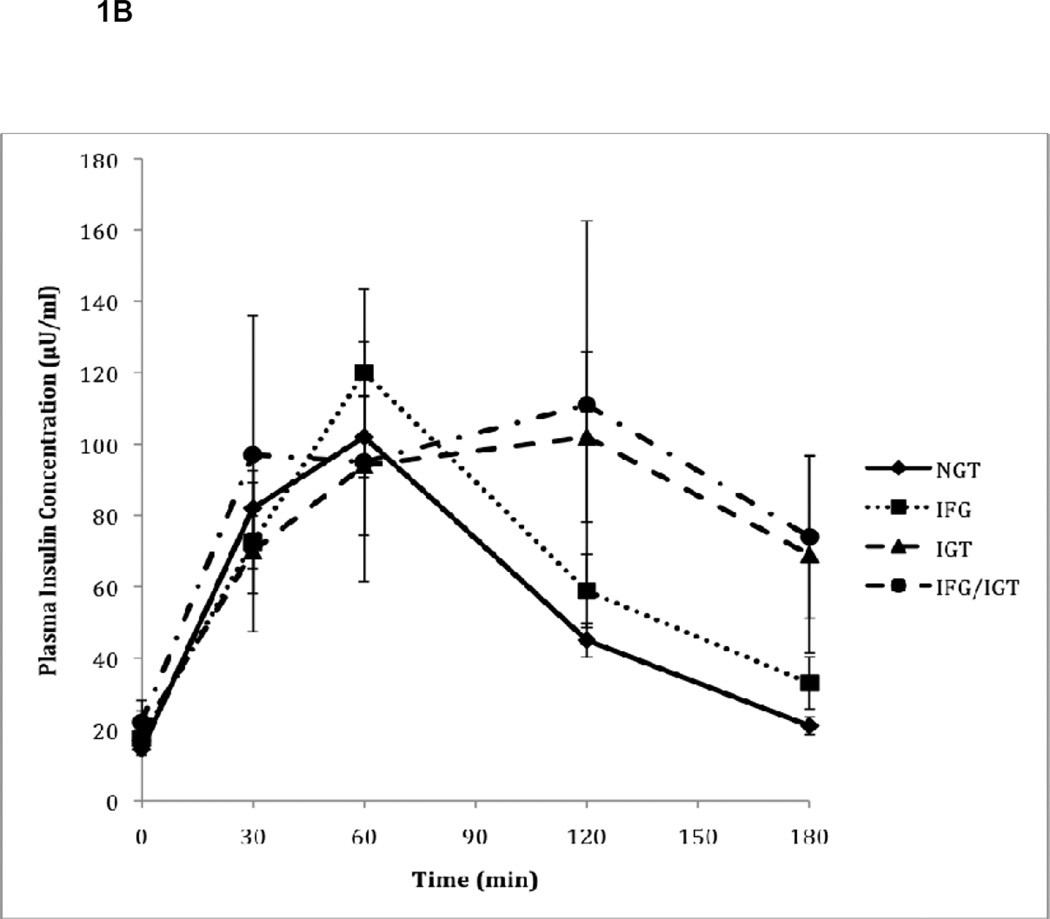
Figure 1.
A. Plasma glucose responses to oral glucose during OGTT in subjects with normal glucose tolerance (NGT), impaired fasting glucose (IFG), impaired glucose tolerance (IGT), and combined IFG/IGT. Values represent mean plasma glucose concentrations (± SE) measured during OGTT for N=97 patients.
B. Plasma insulin responses to oral glucose during OGTT in subjects with normal glucose tolerance (NGT), impaired fasting glucose (IFG), impaired glucose tolerance (IGT), and combined IFG/IGT. Values represent mean plasma insulin concentrations (± SE) measured during OGTT for N=97 patients.


