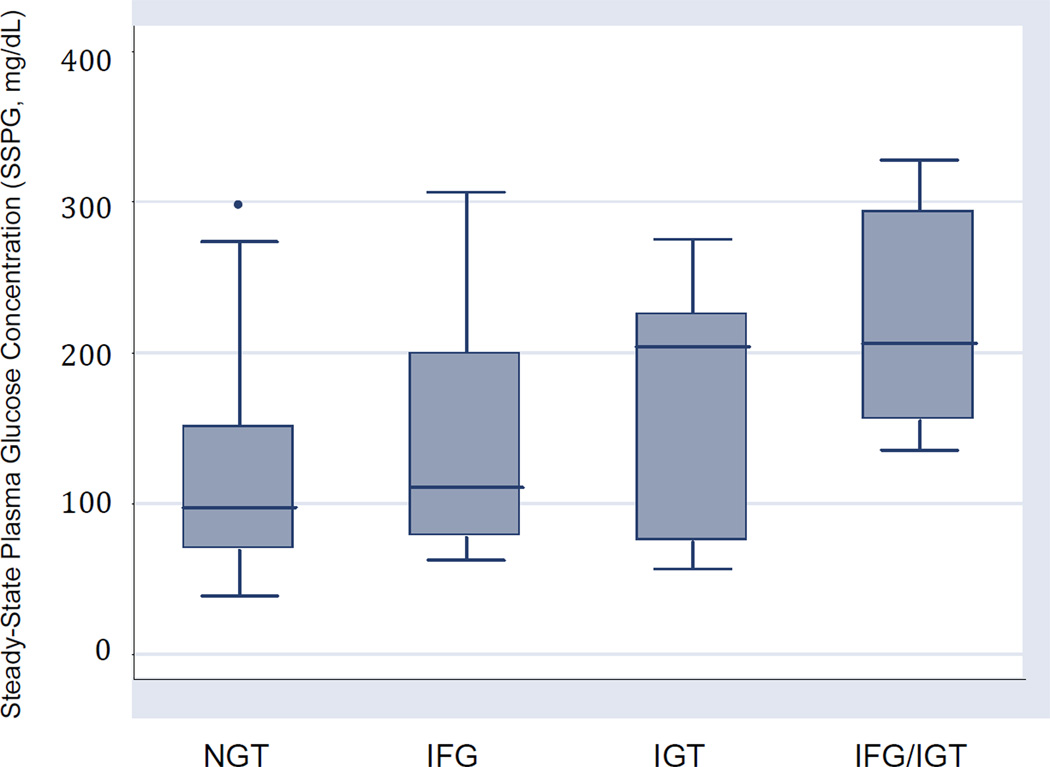
Figure 2. Insulin resistance (SSPG) by glucose metabolism categories.
Box plots illustrate median and range of SSPG concentrations for all four groups of subjects, with boundaries of the box representing upper and lower quartiles. • Outliers with values between 1.5 and 3 box lengths from the boundaries of the box.

