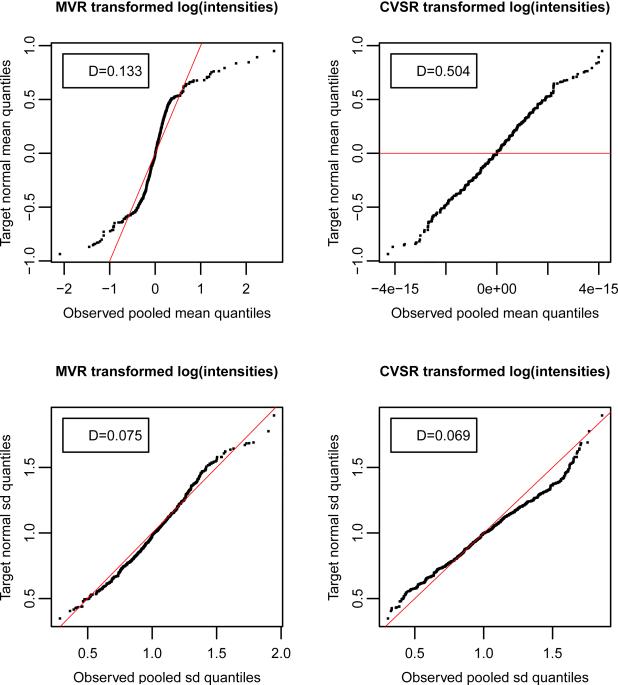
Figure 5.
Comparative quantile-quantile plots to assess the goodness of fit or the lack thereof between observed target moments and those expected under an arbitrary equal-mean/homoscedastic data model. In case of good fit, estimated empirical sample quantiles from the observed data line up with those expected from the equal-mean/homoscedastic data model. Observed transformed means (top row) and standard deviations (bottom row) by MVR (left column) and CVSR (right column) regularization methods. Red line: inter-quartile line. One-sample two-sided Kolmogorov-Smirnov-test statistics are reported in boxes. Results are shown for the synthetic dataset from model 14.

