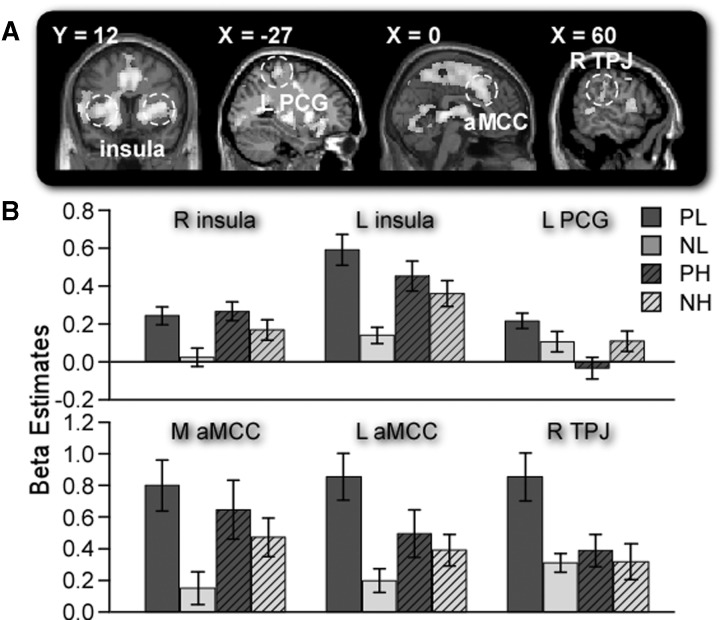
Fig. 2.
(A) Regions of interest [M aMCC (0 27 33), L aMCC (−3 12 42), bilateral insula (L: −36 12 0; R: 33 21 −9), L PCG (−27 −39 60) and R TPJ (60 −28 28)] based on previous studies. L = left hemisphere; R = right hemisphere. (B) Beta estimates for all four trial types in each ROI, showing greater BOLD signal change in the low-money condition than that in the high-money condition. Error bars indicate s.e.m.

