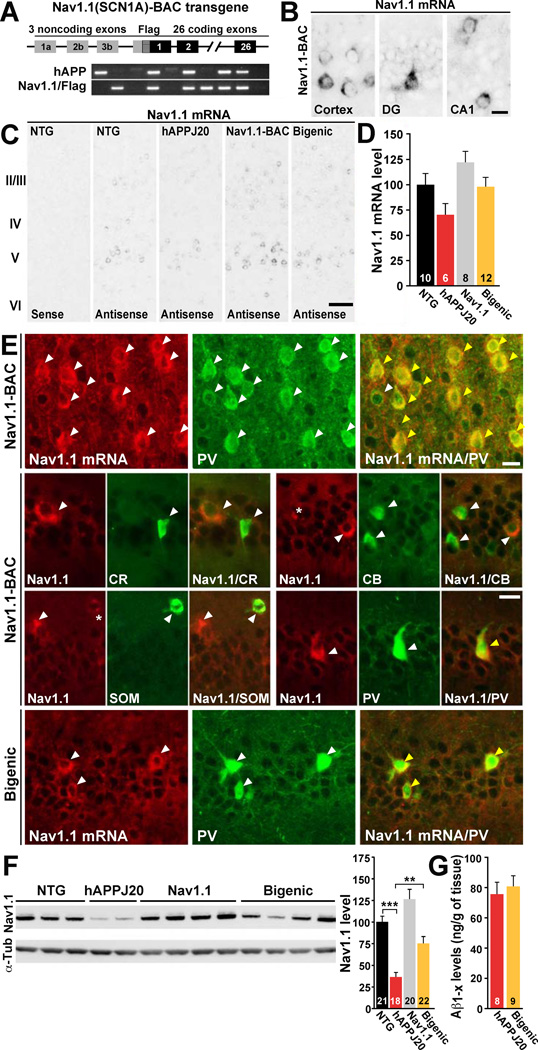
Figure 5. Increasing Levels of Nav1.1 in hAPPJ20 Mice by Nav1.1-BAC Transgene Overexpression.
(A) Nav1.1(SCN1A)-BAC transgene construct and PCR detection of genotypes.
(B–E) Single bright-field in situ hybridization for Nav1.1 (B, C) and double fluorescence in situ hybridization for Nav1.1 (red) and immunohistochemistry (green) (E) for parvalbumin (PV), calretinin (CR), calbindin (CB), or somatostatin (SOM) on cryosections from NTG, hAPPJ20, Nav1.1, and hAPPJ20/Nav1.1 (bigenic) mice. (B) As in NTG mice (Figure S3A), Nav1.1 mRNA expression in Nav1.1 mice was restricted to a few cells. (C) Nav1.1 mRNA expression patterns were similar in all genotypes. (D) Densitometric analysis of Nav1.1 mRNA signals in the parietal cortex (C) revealed that Nav1.1-BAC transgene expression increased Nav1.1 mRNA levels in mice with (p=0.018) or without (p=0.028) hAPP expression (two-way ANOVA). (E) In Nav1.1 and bigenic mice, Nav1.1 mRNA was highly expressed by PV cells but not by other interneuronal populations. Arrowheads indicate single- (white) or double-labeled (yellow) cells. Asterisks indicate very low or putative expression.
(F) Representative western blots (left) and quantification (right) of Nav1.1 levels in the parietal cortex. Nav1.1 levels were increased by Nav1.1-BAC transgene expression in mice with (p<0.001) or without (p<0.001) hAPP (two-way ANOVA). **p<0.01, ***p<0.001 (one-way ANOVA and Tukey test).
(G) Cortical Aβ1-x levels in 3-month-old hAPPJ20 and bigenic mice determined by ELISA. Scale bars: 10 µm (B, E); 50 µm (C). Numbers in bars are mice (D, F, G). Bars represent mean ± SEM.

