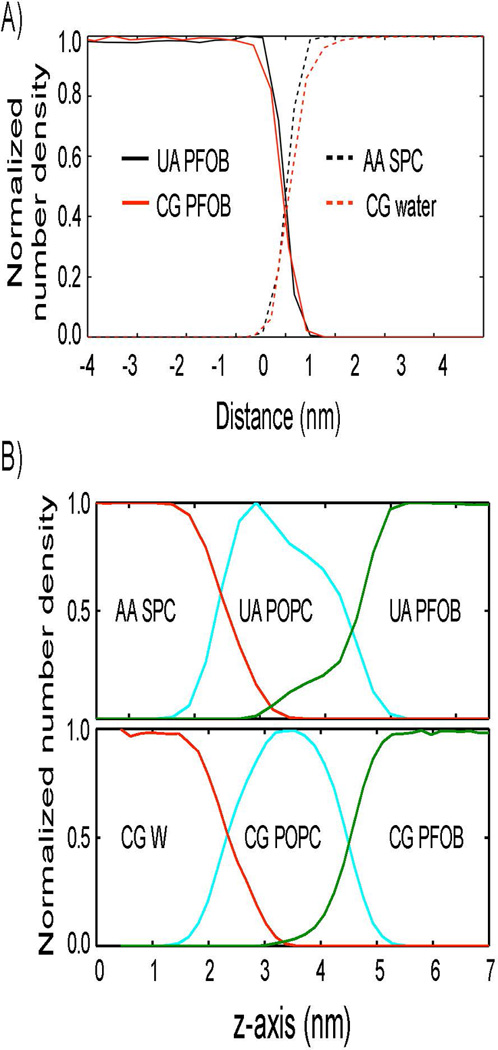
Figure 2.

Interface structure comparison between atomistic and coarse-grained simulations A) in the absence and B) in the presence of an emulsifying phospholipid monolayer. A) The normalized number density profiles of water are shown in dotted red (coarse-grained) and black (atomistic) lines along the interface normal direction. Those of PFOB are shown in solid red (coarse-grained) and black (atomistic) lines. B) The top panel presents the normalized number density profiles of water (red), POPC monolayer (cyan), and PFOB (green) that were determined from an atomistic simulation. The bottom panel presents the same data that were determined from a coarse-grained simulation.
