
Figure 5.
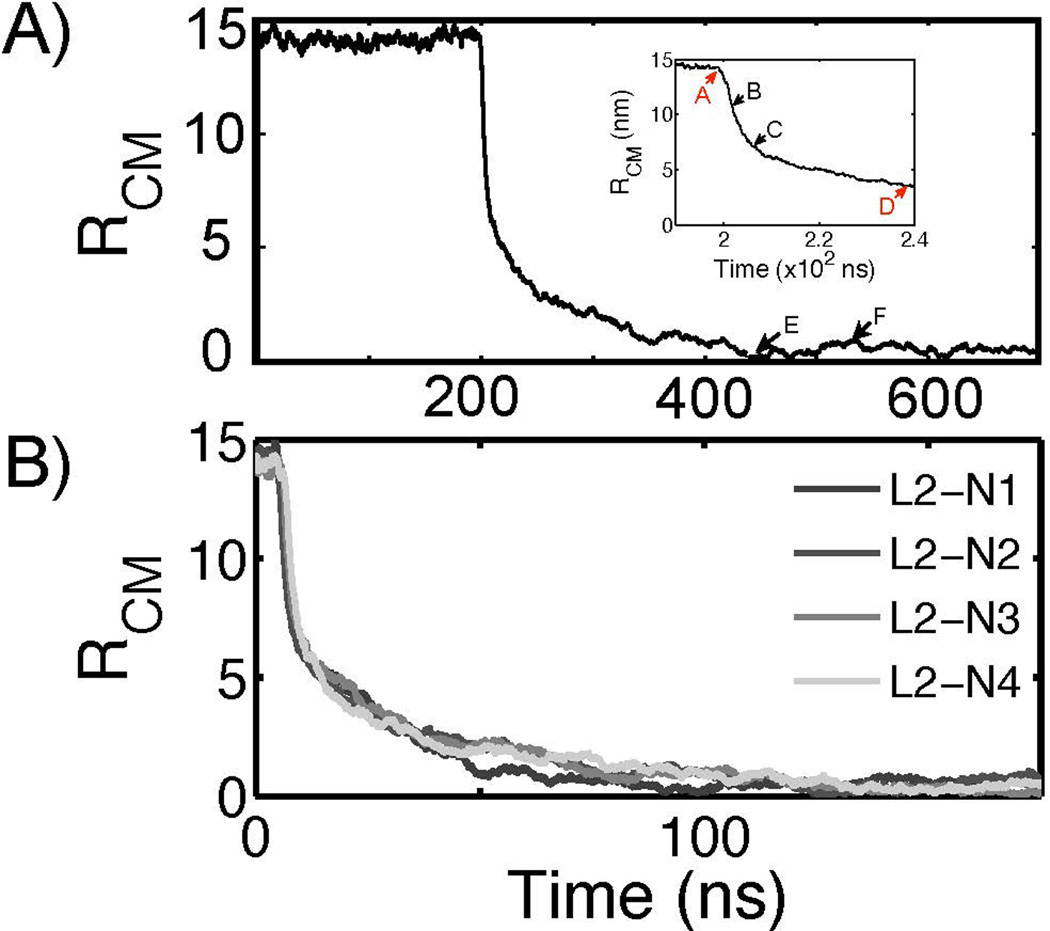
A reaction coordinate used to analyze the fusion process. A) The evolution of RCM, the distance between the center of mass of each particle, is plotted as a function of time. Once the fusion is initiated, RCM rapidly decreases to zero. The inset figure shows the four points (A, B, C, and D) based on the RCM metric. A is when RCM starts to drastically decrease, B is when RCM is decreased by 25%, C by 50%, and D by 75%. E and F are arbitrarily chosen to show the structures after fusion event is completed. The corresponding structures at each time point are shown in Figure 4. This example RCM profile is obtained from the fusion simulation L2-N2-1. B) The profiles of RCM of four different fusion simulations are superimposed after aligned such that that the time point A of each profile overlaps. This figure shows that the subsequent steps after fusion is initiated are kinetically indistinguishable.